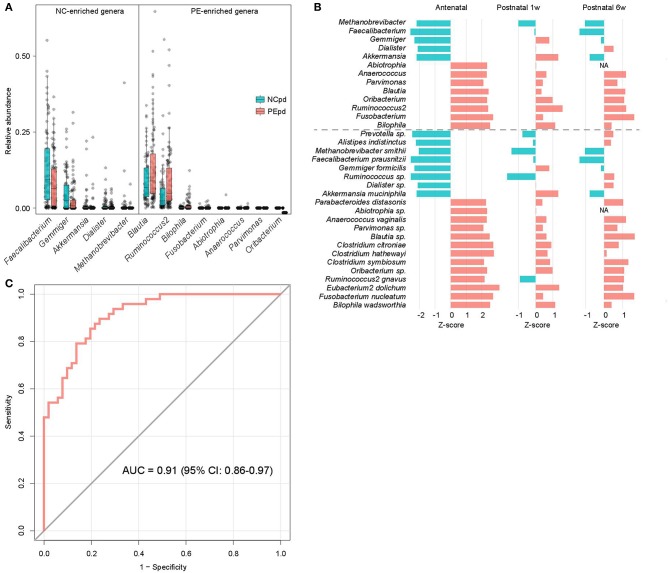
Figure 2.
Difference of gut microbiota between PE patients and healthy controls. (A) Boxplot shows the significantly different genera between patients and controls. Genera with P < 0.05 (Wilcoxon rank-sum test) of samples at antepartum are shown. The boxes represent the interquartile range (IQR) between the first and third quartiles and the line inside represents the median. The whiskers denote the lowest and highest values within 1.5 times IQR from the first and third quartiles, respectively. (B) The PE-associated genera and species of samples at antepartum, and their tendencies in samples at 1 and 6 weeks postpartum. The bar lengths indicate the Z-score of a genus or species at different time points, and the colors represent enrichment in patients (red, Z-score > 0) or controls (blue, Z-score < 0). (C) ROC analysis for classification of PE status by the relative abundances of PE-associated genera, assessed by AUC.

