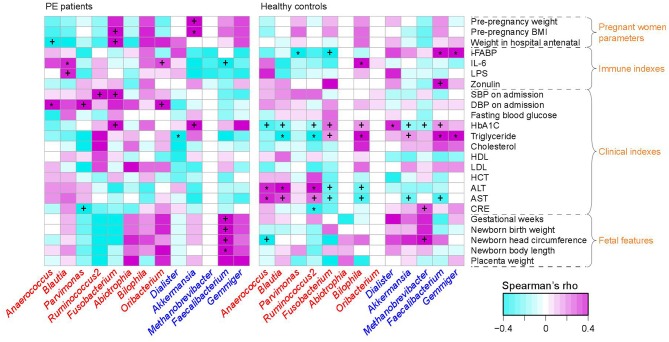
Figure 3.
Correlation between PE-associated genera and the host parameters. The heatmap panel shows the Spearman correlation coefficient between the genera (text color: red, enriched in PE patients; blue, enriched in healthy controls) and host parameters. Significance levels in correlation tests are denoted: +,q < 0.10; *,q < 0.05.

