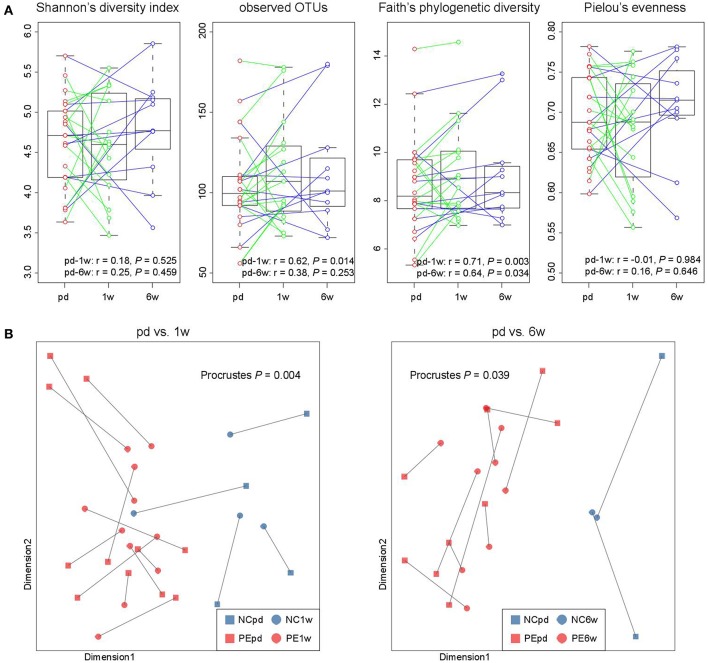
Figure 5.
Longitudinal comparison of gut microbial diversity and composition between antepartum, 1 and 6 weeks postpartum. (A) Change in alpha diversity from the antepartum to 1 and 6 weeks postpartum. The boxes represent the interquartile range (IQR) between the first and third quartiles and the line inside represents the median. The whiskers denote the lowest and highest values within 1.5 times IQR from the first and third quartiles, respectively. Pearson correlation coefficient of samples between two time points was calculated, and P-value was tested using the correlation test. (B) Procrustes analysis reveals the covariation between samples at the antepartum, 1 and 6 weeks postpartum periods.

