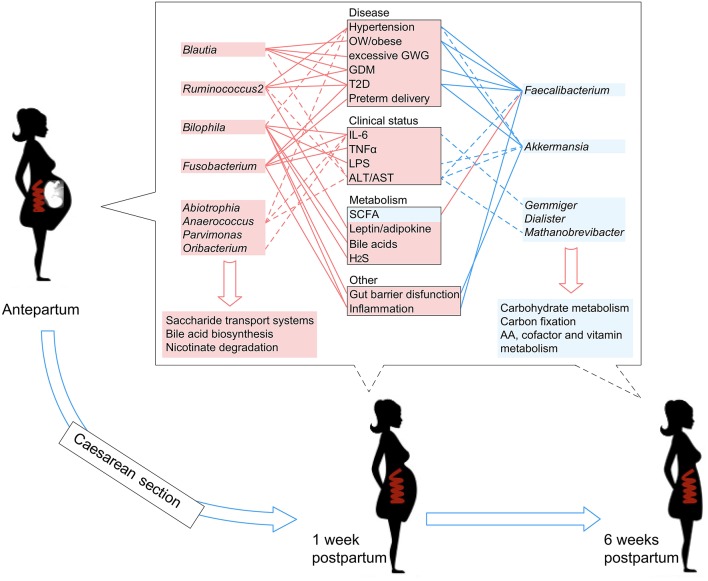
Figure 6.
A schematic diagram showing the PE-associated bacteria and functions that had predicted effects on the host disease, clinical status, and metabolism. The PE-enriched species and functions are shown in the left red columns, and the PE-depleted species and functions are shown in the right blue columns. Center boxes show the host properties. Lines connect the PE-associated species and host properties with potential associations, while the dotted lines indicate the correlations which were identified in this study.

