
Figure 4.
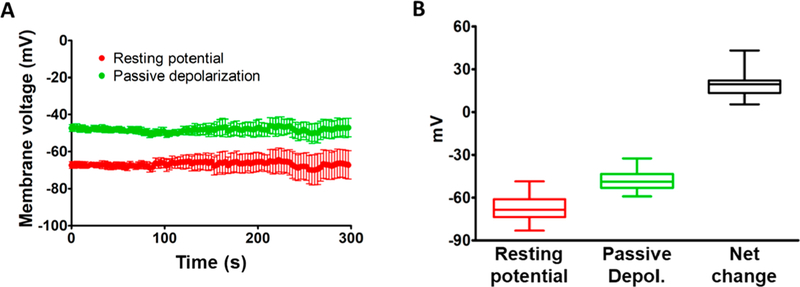
Time-dependence of passive depolarization mediated by AuNP–PEG–Chol. (A) Red symbols, resting potentials (mean ± SEMs) of 4–15 cells determined over a 5 min period. Green symbols, passive depolarizations (mean ± SEMs) directly induced by the laser pulse. The number of cells described by the data decreased from an initial population of 15 down to 4 during the period of investigation (due to loss of the patch seal on a number of cells), and the progressive increase in SEMs determined over this period can be attributed to this decreasing population. (B) Summary of the data presented in panel A. Red, green, and black symbols indicate data obtained for resting potential, potential at the peak of passive laser-induced depolarization, and the net change induced by this depolarization, respectively. See text for further details.