
Figure 3: Enrichment of efficient origins and of origin positions with G-quadruplexes:
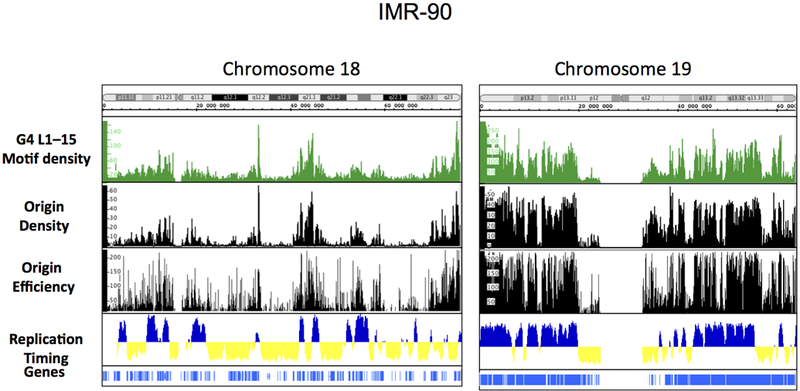
Visualization of G4 L1–15 density (top), origin density and efficiency (middle) and replication timing (bottom) in Integrated Genome Browser (IGB), on whole chromosome 18 and on whole chromosome 19. Cytobands and Refseq genes are shown.