
Figure 4: Enrichment of origins on actively transcribed genes:
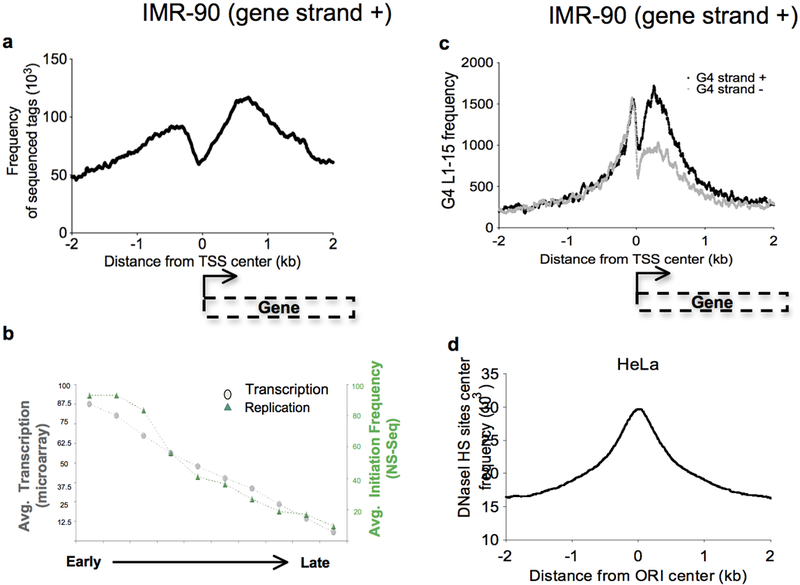
(a) Frequency of origin sequenced tags along 4-kb regions centered on the TSS of genes transcribed on the plus strand in IMR-90 cells. (b) Histogram showing the correlation between the average transcription level and the average initiation frequency according to the replication timing. (c) Number of G-quadruplex L1–15 along 4-kb regions centered on the TSS of genes transcribed on the plus strand in IMR-90 cells with respect to the strand on which G-quadruplexes are localized. (d) Frequency of DNaseI HS sites (ENCODE/OpenChrom Duke University) along 4-kb regions centered on the origin center in HeLa cells.