
Figure 5: Enrichment of replication origins in (G+C)-rich regions showing a similar distribution of origins and isochores.:
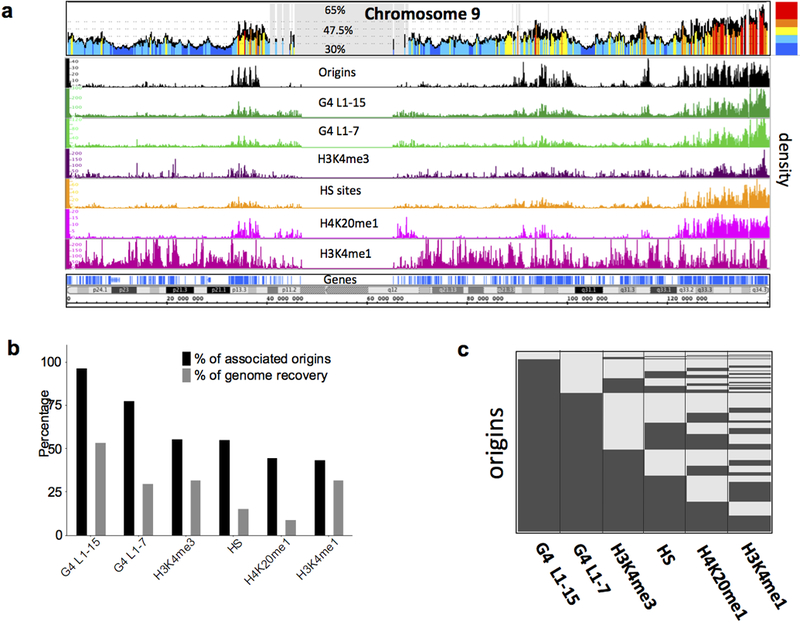
Analyses of identified origin peaks in HeLa cells that are common with 3 other cell types (hESC H9, iPSC and IMR-90). (a) Visualization of isochores (top) and visualization in Integrated Genome Browser (IGB) of origin density (middle) and genome elements’ density (bottom), on whole chromosome 9. Cytobands are shown. (b) Percentage of origins associated with different genome elements and percentage of genome recovered by each corresponding genome element. (c) Heatmap showing the association of origins with different genome elements (dark gray represents associated origins, light represents non associated).