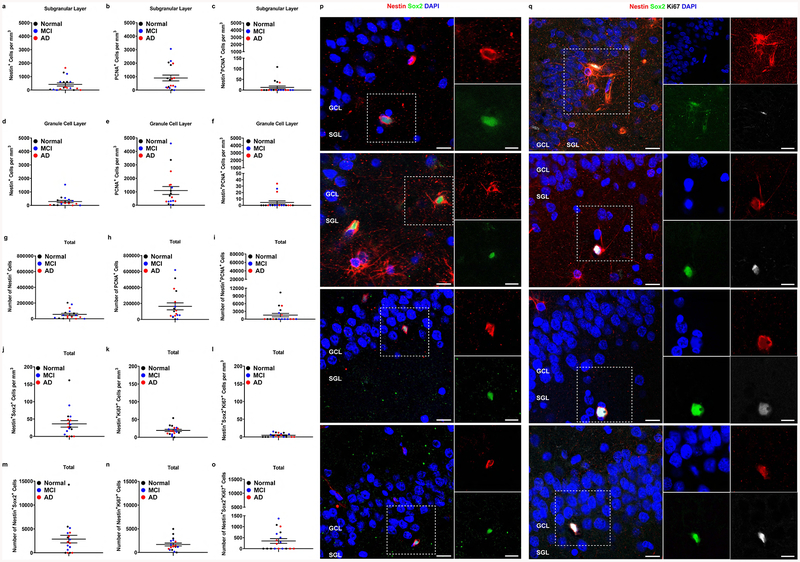
Figure 1. Counts of neural progenitor cells in the hippocampus of aged humans.
a-c. Cell counts in the SGL: Nestin+ (a), PCNA+ (b), Nestin+PCNA+ (c). d-f. Cell counts in the GCL: Nestin+ (d), PCNA+ (e), and Nestin+PCNA+ (f). g-i. Cell counts upweighted to DG volume: Nestin+ (g), PCNA+ (h), and Nestin+PCNA+ (i). j-l. Total cell counts in the DG: Nestin+Sox2+ (j), Nestin+Ki67+ (k), Nestin+Sox2+Ki67+ (l). m-o Cell counts upweighted to DG volume. Nestin+ (m), Nestin+Ki67+ (n), Nestin+Sox2+Ki67+ (o). Data represent the mean ± SEM of all 18 subject with each data point corresponding to a single subject. Clinical diagnosis is color coded (black = normal, no cognitive impairments, blue = mild cognitive impairments, red = Alzheimer’s disease). p,q. Representative images of Nestin+Sox2+ (p) or Nestin+Sox2+Ki67+ (q) -expressing cells. (GCL and SGL are noted, white outline = area presented in high power on the right). Scale bar represents low magnifications images (left panel): 20 μm, high magnification images (right panel): 10 μm.

