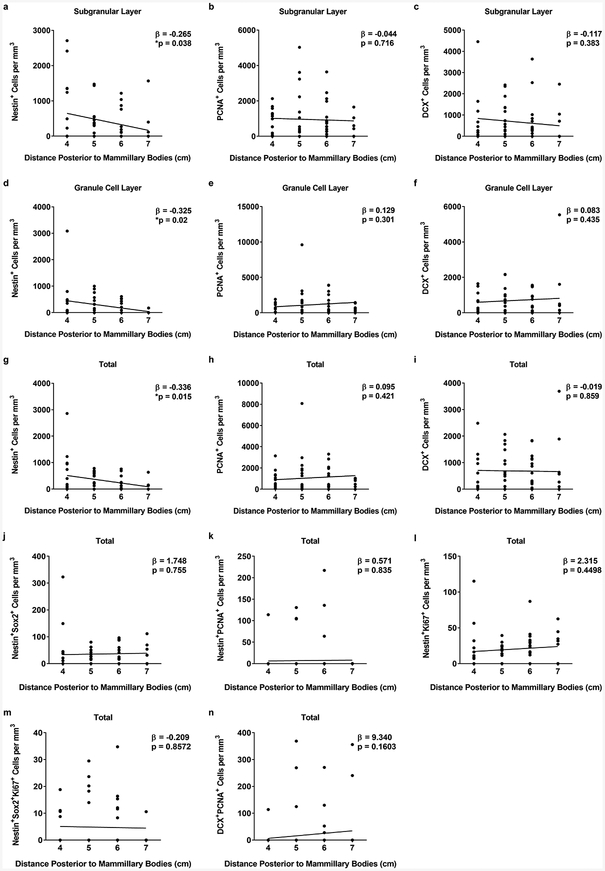
Figure 3. Correlation of cell numbers along the dorsal/ventral axis of the hippocampus.
a-c. Correlation of Nestin+ (a), PCNA+ (b), and DCX+ (c) cell counts in the SGL. d-f. Correlation of Nestin+ (d), PCNA+ (e), and DCX+ (f) cell counts in the GCL. g-n. Correlation of total Nestin+ (g), PCNA+ (h), DCX+ (i), Nestin+Sox2+ (j), Nestin+PCNA+ (k), Nestin+Ki67+ (l), Nestin+Sox2+Ki67+ (m) and DCX+PCNA+ (n) cell counts upweighted to DG volume. Coefficients (β) were estimated with each cell volume normalized with mean and standard deviation.

