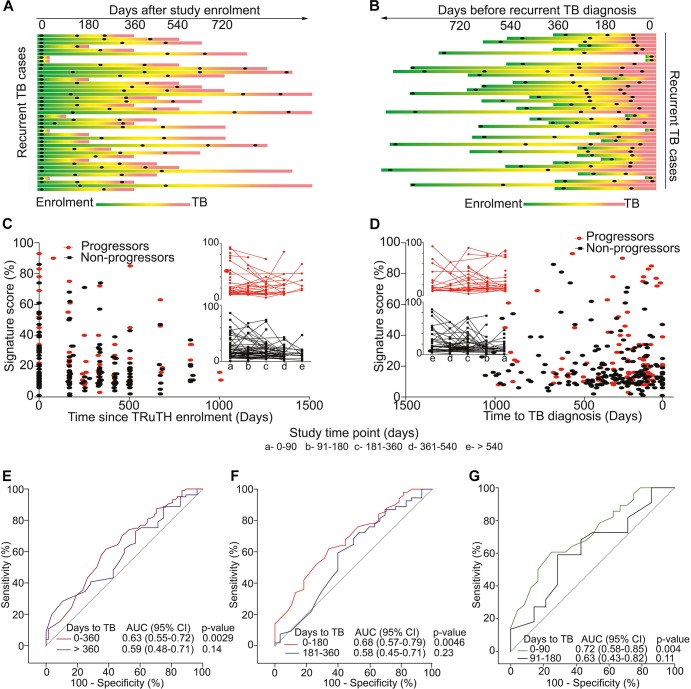
FIGURE 2.
Study design and 11-gene ACS COR signature performance in the TRuTH study. Horizontal lines depict the 43 TRuTH cohort progressors and show PBMC samples (black dots) collected in each individual. (A) TRuTH progressors aligned to their time of TRuTH study enrolment. The time of TB diagnosis is indicated by the most left-hand end of each line (in red). (B) Re-alignment of TRuTH progressors and their samples according to each individual’s date of TB diagnosis (on the right) to facilitate analyses of changes by “time to recurrent TB.” (C) 11-gene ACS COR signature scores at each participant visit for progressors (red) and non-progressors (black), aligned by time since TRuTH enrolment. Inserts show the longitudinal kinetics of these scores for progressors (red, top) and non-progressors (black, bottom). 90-day time windows relative to enrolment are depicted by the letters on the x-axis. (D) 11-gene ACS COR signature scores realigned to time to recurrent TB diagnosis. (E–G) ROC AUCs depicting prognostic performance of the 11-gene ACS COR signature for recurrent TB, showing discrimination of progressors from non-progressors in the TRuTH cohort. Each curve represents a 1-year (E), 6-month (F) or 3-month (G) time window prior to recurrent TB diagnosis.

