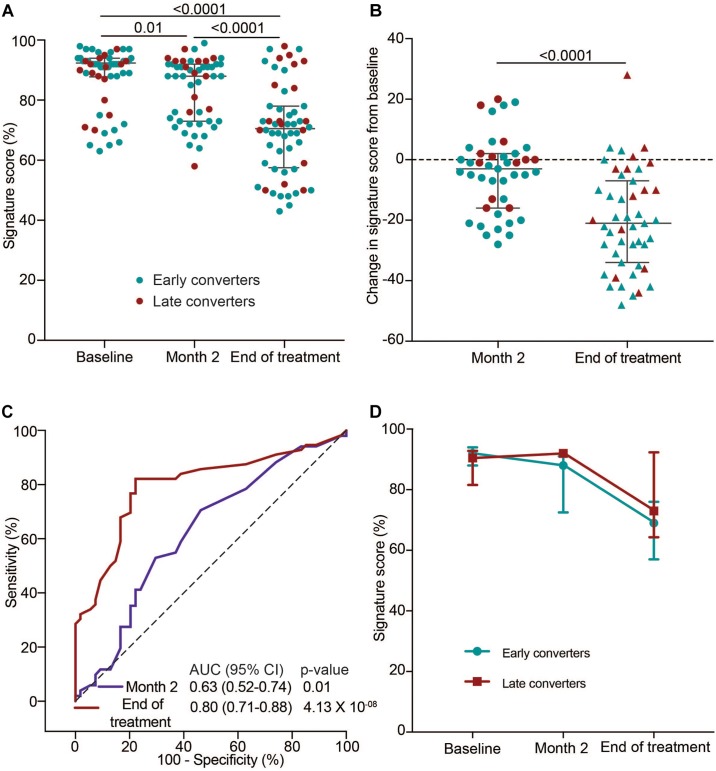
FIGURE 3.
TB treatment response monitoring in the IMPRESS cohort using the 11-gene ACS COR signature. (A) 11-gene ACS COR signature scores before (baseline), during (after intensive phase, at 2 months) or after treatment of recurrent TB in the IMPRESS study. (B) Differences in signature scores at 2 months or end of treatment relative to treatment baseline. Red dots represent individuals with sputum culture conversion after 2 months (late converters) and blue dots individuals with culture conversion before 2 months (early converters). Horizontal lines represent medians and error bars the inter-quartile ranges (IQR). p-values were calculated using the Wilcoxon matched pairs test. (C) ROC AUCs depicting signature discrimination between baseline and month two or end of treatment samples. (D) Longitudinal kinetics of median signature scores during TB treatment in early and late converters. Error bars represent the IQR.

