Figure 3.
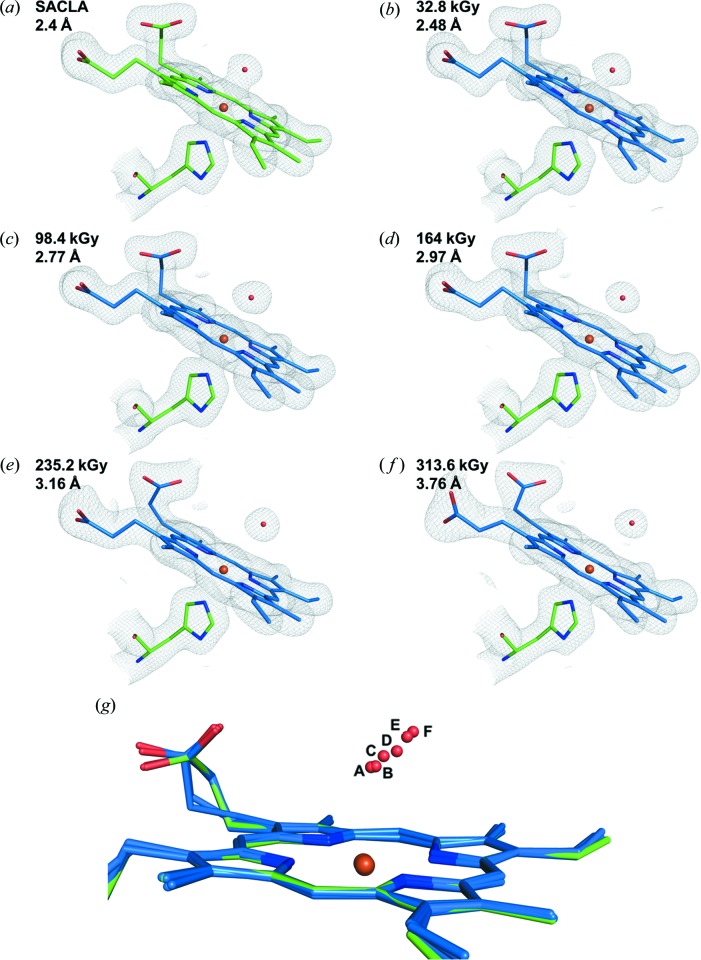
2F o–F c electron-density maps contoured at 1σ for the heme environment of DtpAa in (a) the SFX dataset from SACLA and (b–f) selected structures from the two MSS series. (g) Superposition of selected structures revealing the dose-dependent migration of the water molecule W1 away from the heme Fe. The SFX structure is shown in green with MSS in blue.

