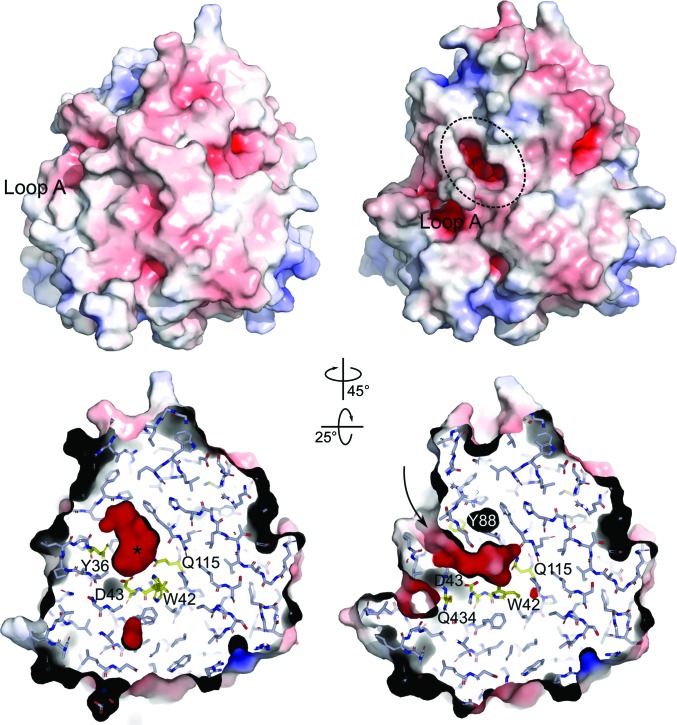
Figure 3.
Closed and open conformations of MhGgH. Solid-surface representation coloured according to electrostatic potential [contoured from −8 kT/e (red) to 8 kT/e (blue)] (upper panel) and cross-section (lower panel) of MhGgH in closed (left) and open (right) conformations. In the closed state (left), the active-site cavity (marked with an asterisk) becomes inaccessible to the solvent. In the open state (right), an opening leading to an acidic cavity is observed (dashed ellipse; upper panel); a negatively charged tunnel (arrow) connects the active-site cavity to the exterior of the molecule (lower panel). Substrate-binding residues are highlighted in yellow. The left and right poses in each panel are related by 25° and 45° rotation around x and y, respectively.

