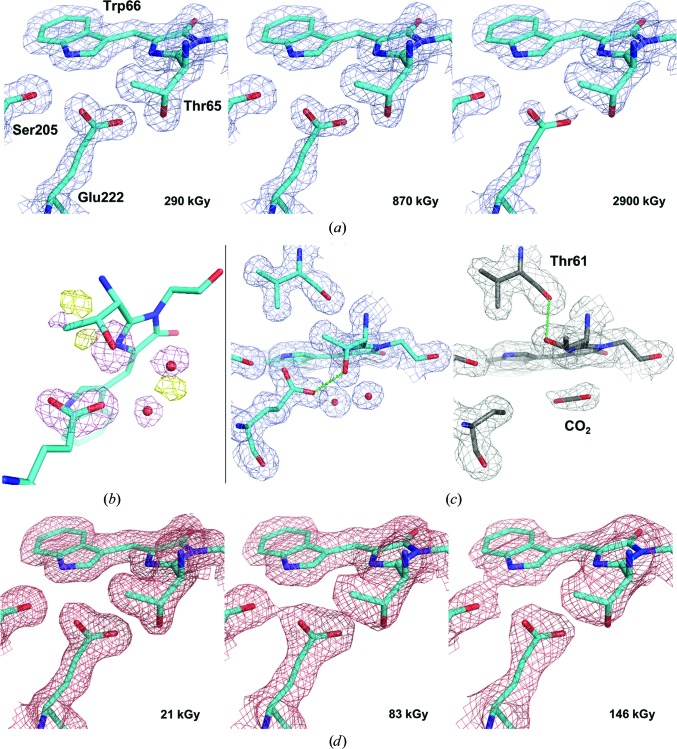
Figure 1.
Evolution of the (2mF obs − DF calc, αcalc) electron-density map in data sets from a Cerulean crystal recorded at increasing absorbed doses at cryogenic and room temperature. (a) Series recorded at 100 K (maps contoured at a 1.5σ level). (b) [F obs(20) − F obs(1), αcalc(1)] Fourier difference map calculated between the final and the initial 100 K data sets, highlighting the specific radiation damage to Glu222 and its structural consequences (maps contoured at a ±5.0σ level). (c) (2mF obs − DF calc, αcalc) electron-density map for the first (left) and the last (right) 100 K data sets, illustrating the decarboxylation process of Glu222 and the rotation of Thr65 (maps contoured at a 1.0σ level). (d) Series recorded at 293 K (maps contoured at a 1.5σ level).

