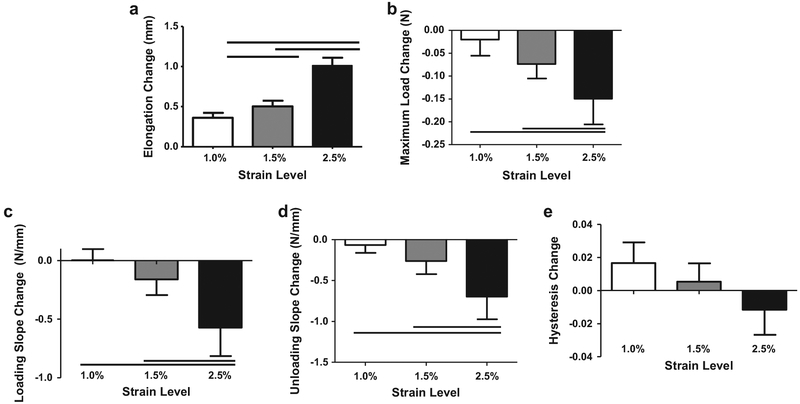
Fig. 1.
Diagnostic changes (pre-versus post-loading) for 500 cycle groups in elongation (a) were greater with increased strain. Decreases in minimum load (b), loading (c) and unloading slope (d) were greater in 2.5% groups when compared with 1.0% and 1.5%. Change in hysteresis (e) did not vary with strain. Bar denotes p < 0.05.

