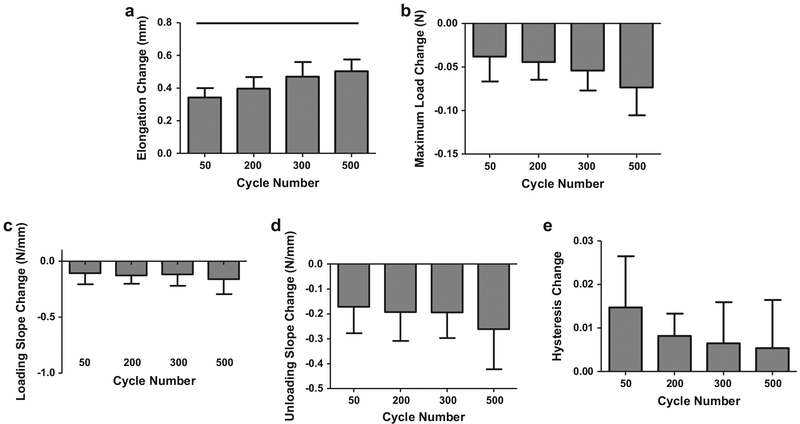
Fig. 2.
Diagnostic changes (pre-versus post- fatigue loading) for 1.5% strain groups in elongation (a) were significantly greater in 500 than 50 cycle groups. Changes in minimum load (b), loading slope (c), unloading slope (d), and hysteresis (e) did not vary with cycle number. Bar denotes p < 0.05.

