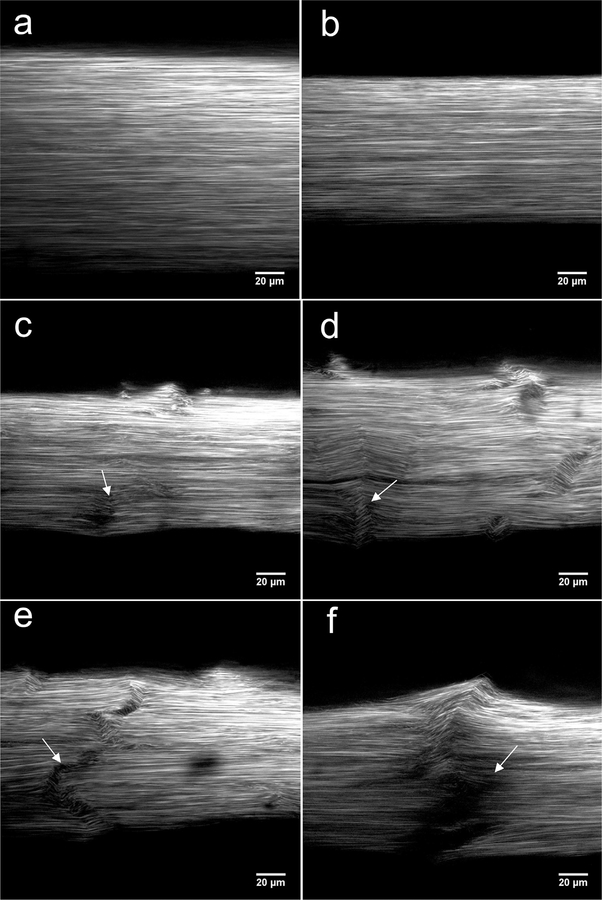
Fig. 4.
Representative SHG images of control (a) and 1.0%, 500 cycle (b) showed highly aligned collagen. Areas of fibril deformation and kinking were smaller in 2.5%, 50 cycle (c, arrow), and larger in 2.5%, 300 cycle (d, arrow) groups. Width-spanning discontinuity was observed in 2.5%, 500 cycle fatigue groups (e and f, arrows). Images shown were taken from random image stacks at random depth and image width is not indicative of actual tendon width.

