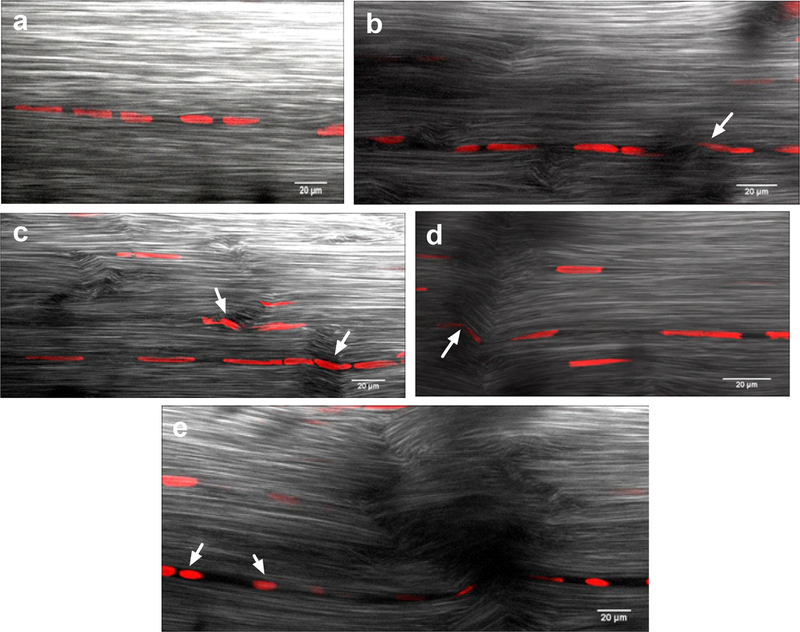
Fig. 6.
Representative nuclear morphology TPEF images was similar to control for the 1.0%, 500 cycle group (a). Nuclear deformation was minor in the 2.5%, 50 cycle group (b, arrow) and more severe in the 2.5%, 300 cycle groups (c and d, arrows). Nuclear rounding was observed in the 2.5%, 500 cycle group (e, arrows).

