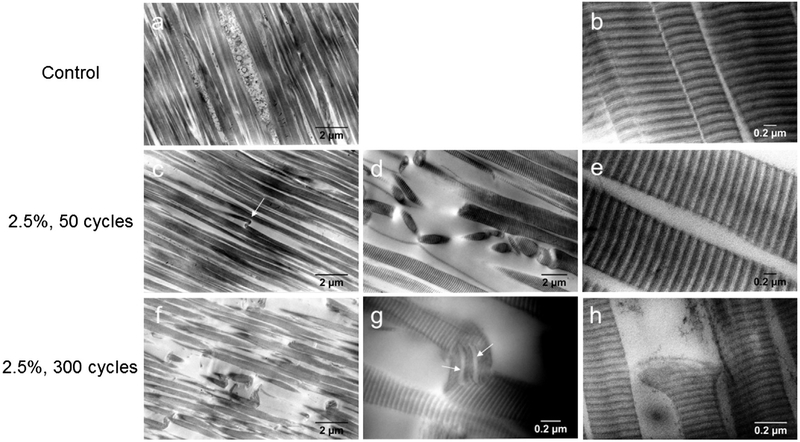
Fig. 7.
TEM images of collagen fibrils at various magnification in control groups showed highly aligned collagen (a) and tight fibril spacing (b). The 2.5%, 50 cycle group showed singular kinks (c, arrow), sub-fibrillar twisting and some multi-fibrillar damage regions (d) with greater spacing between fibrils (e). 2.5%, 300 cycle fatigue group showed several fibril bends and ruptures (f) and sub-fibrillar separation (g, arrows) and rupture (h). No differences between control and 1.0%, 300 cycles were observed.

