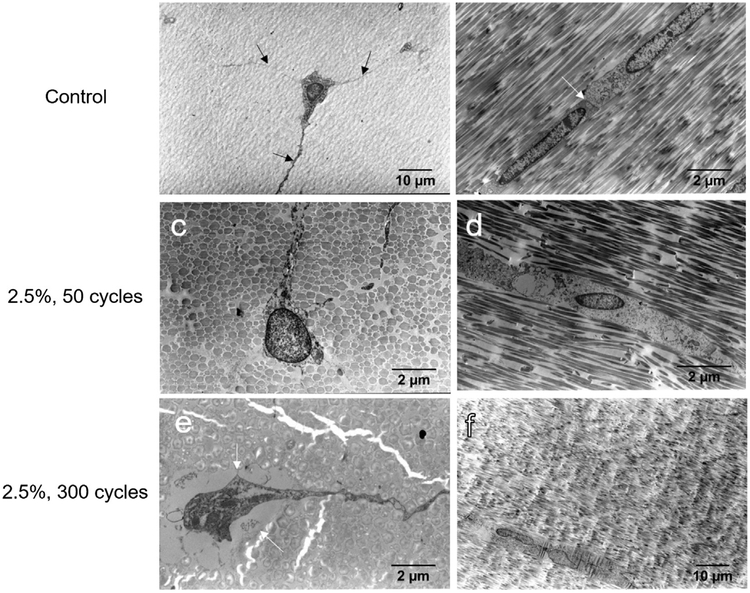
Fig. 8.
TEM images of tenocytes in control groups showed characteristic cell extensions (a, arrows) and contact between tenocytes (b, arrow). 2.5%, 50 cycle groups showed disrupted cytoplasmic processes (c) but preserved morphology (d). 2.5%, 300 cycle fatigue groups showed cell separation from the surrounding matrix (e, arrows) and evidence of necrotic processes (f). Sections were (a,c,e) transverse and (b,d,f) longitudinal.

