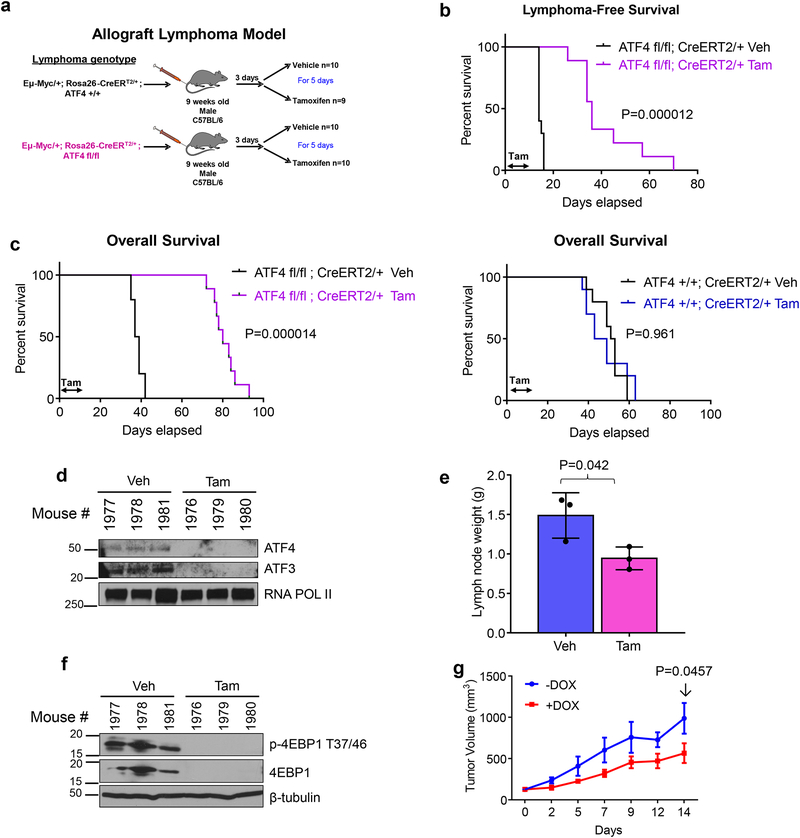
Figure 5. Acute ablation of ATF4 significantly delays MYC driven Lymphomagenesis and promotes survival of MYC driven lymphoma bearing mice.
a. Schematic showing allograft lymphoma model, where lymphoma cells are injected via tail vein into 9-weeks old C57BL/6J mice. Three days after lymphoma engraftment, mice are randomized to receive either vehicle or tamoxifen treatment by oral gavage for 5 days. b. Kaplan-Meier analysis for lymphoma-free survival of mice bearing Eμ-myc; ATF4fl/fl lymphoma treated with either vehicle (veh) or tamoxifen (tam) for 5 days. n=9 for Eμ-myc; ATF4fl/fl lymphoma tamoxifen group, all other groups n=10. Kaplan-Meier curves were analyzed by two-tailed log-rank test. c. Kaplan-Meier analysis for overall survival of mice bearing Eμ-myc; ATF4fl/fl lymphoma (left) or Eμ-myc; ATF4+/+ lymphoma (right). Kaplan-Meier curves were analyzed by two-tailed log-rank test. d. Immunoblot of B cells isolated from Eμ-myc; ATF4fl/fl lymphoma bearing mice a day after the last day of tamoxifen treatment. e. Lymph node weight of mice in panel d, n=3 per group, error bars represent mean ± SD, two tailed student t-test. f. Immunoblot of lymphoma lysates from mice in panel e. For d and f, lysates from three different mice per treatment were used. g. DLD-1, MycER, i-shATF4 cells were transplanted into 12-week-old nude mice and tumor size is shown. One (−) Dox mouse had to be sacrificed on day 12 because tumor reached maximum size limit. n=4 (−) Dox and n=4 (+) Dox. Two-way ANOVA, error bars represent mean± SEM. Unprocessed scans of blots are shown in Supplementary Fig 7.

