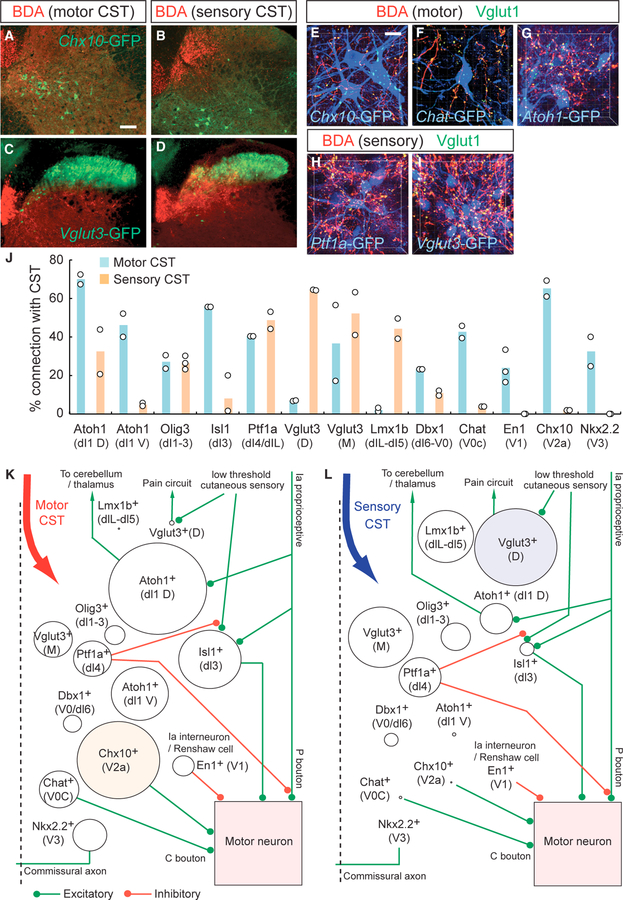
Figure 3. Connectivity of CS Axons and Spinal INs.
(A–D) Representative images of BDA-labeled motor (A and C) and sensory CS axons (B and D) (red) and GFP-labeled Chx10+ and Vglut3+ spinal INs in Chx10-Cre (A and B) and Vglut3-Cre; CC-EGFP (C and D) mice. Scale bar, 100 μm. (E–I) Higher-magnification views of connections between INs and CS axons. BDA+ motor (E–G) and sensory CSTs (H and I) (red), GFP+ spinal INs (blue), and Vglut1+ presynaptic terminals (green) in Chx10-Cre (E), Chat-Cre (F), Atoh1-Cre (G), Ptf1a-Cre (H), and Vglut3-Cre (I);CC-EGFP mice. The z stack confocal images have pseudo-colors. Scale bar, 20 mm. (J) The percentage of spinal INs connected with motor (light blue) and sensory CSTs (light orange) (n = 2–3 animals per IN subtype). (K and L) Connectivity maps of motor (K) and sensory CSTs (L) with spinal INs. Strength of anatomical connections (percentage of cells receiving CS input, from J) 3 mean number of Vglut1+/BDA+ synapses onto this population (Figure S4J) are represented by varying circle sizes, with green and red lines depicting excitatory and inhibitory connections, respectively, based on previous reports. See also Figures S2 and S3.

