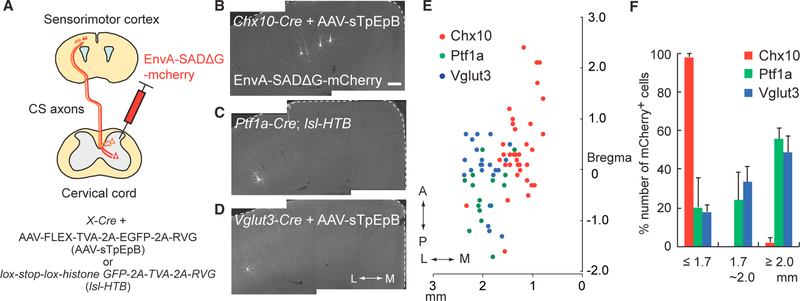
Figure 4. Monosynaptic Tracing of CSNs Connected to Specific Spinal INs.
(A) Diagram of monosynaptic retrograde tracing assay using EnvA-coated G-deleted rabies virus expressing mCherry (EnvA-SADΔG-mcherry). G and TVA proteins were expressed in specific INs by the use of Cre mice together with AAV1-FLEX-TVA-2A-EGFP-2A-RVG (for Chx10+ and Vglut3+ INs) or lox-stop-lox-histone GFP-2A-TVA-2A-RVG mice (for Ptf1a+ INs). (B–D) Representative images of CSNs traced from Chx10+ (B), Ptf1a+ (C), and Vglut3+ (D) INs. In the panels, two images were combined to cover medial and laterals region of the cortex. White dotted lines show the cerebral cortex margins. Coronal section: right, medial; left, lateral. Scale bar, 100 μm. (E) Plotting of EnvA-SADΔG-mCherry+ CSNs traced from Chx10+ (red), Ptf1a+ (green), and Vglut3+ (blue) INs. Top view of the cortex. (F) Ratios of EnvA-SADΔG-mCherry+ CSNs traced from Chx10+ (red), Ptf1a+ (green), and Vglut3+ (blue) INs in ML % 1.7 mm, 1.7–2.0 mm, and R2.0 mm to total labeled neurons. Data are represented as mean ± SEM (n = 3). See also Figure S4.

