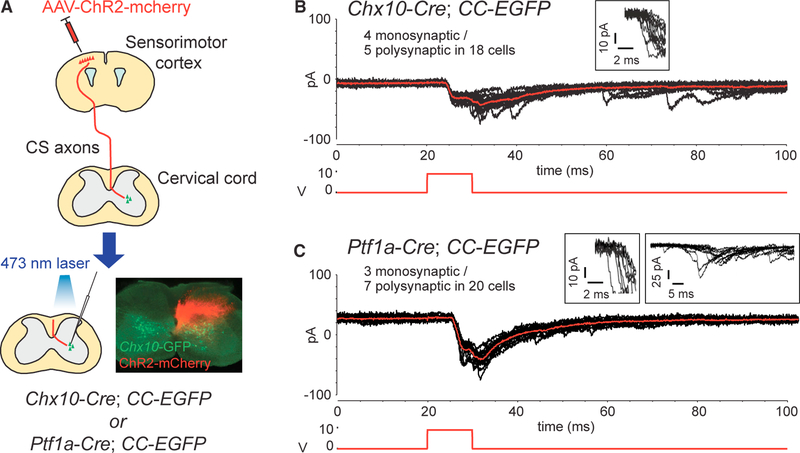
Figure 5. Functional Connections between CS Axons and Spinal INs.
(A) Diagram of optogenetic stimulation and whole-cell patch-clamp recordings. ChR2-expressing CS axons were stimulated with a laser, and Chx10-GFP+ or Ptf1a-GFP+ spinal INs were recorded in slices. (B and C) Representative images of putative monosynaptic EPSCs recorded in Chx10-GFP+ (B) and Ptf1a-GFP+ INs (C) following the stimulation. Red trace, an average of 10 sweeps (black); lower traces in red, the 10-ms optical stimulation; traces in the boxes (B and C, left), the onset of the EPSCs by 10-Hz stimulation; traces in the right box of (C), an example of polysynaptic EPSCs with a greater variability in onset latency (i.e., jitter).

