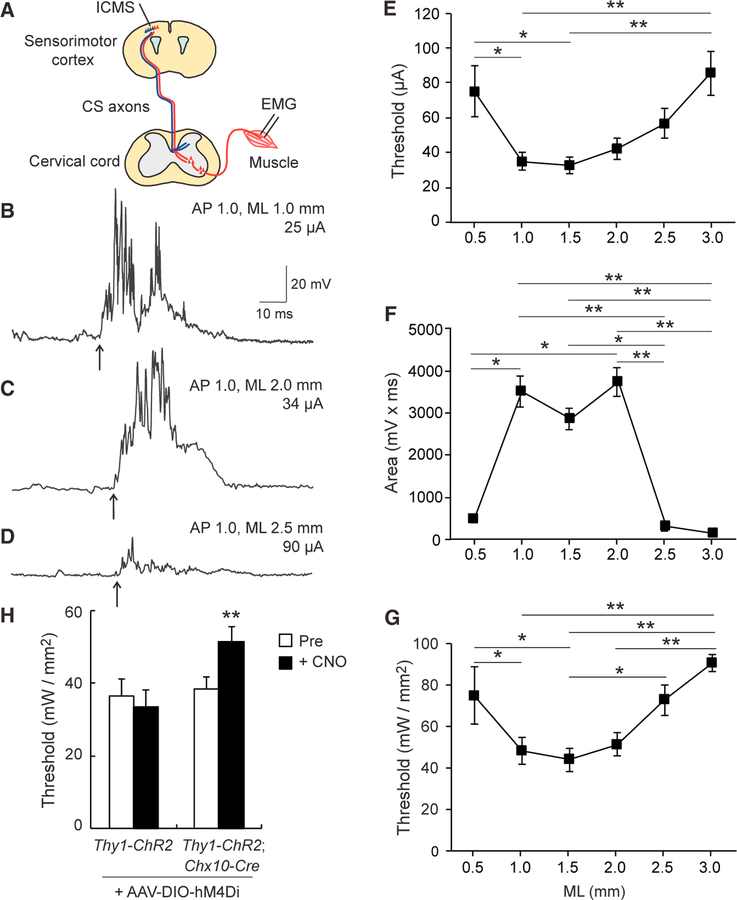
Figure 6. Electrophysiological Analyses of Cortex-Spinal Cord-Muscle Circuits.
(A) Diagram of the ICMS and EMG experiments. Different areas of the sensorimotor cortex were stimulated by ICMS, and EMGs were recorded from contralateral biceps muscle. (B–D) Representative EMG responses evoked by ICMS at different mediolateral cortical areas. Stimulation was conducted at the threshold current in AP 1.0, ML 1.0 (B), 2.0 (C), and 2.5 mm (D). (E) Quantitative data of ICMS thresholds for EMG responses at different cortical areas from ML 0.5 to 3.0 mm. Mean ± SEM; one-way ANOVA followed by Tukey’s test, *p < 0.05 and **p < 0.01; n = 8–12. (F) Strength of EMG responses by ICMS (mV × ms) at threshold amplitudes at cortical areas from ML 0.5 to 3.0 mm. Kruskal-Wallis test followed by Dunn’s test, *p < 0.05 and **p < 0.01; n = 8–12. (G) Thresholds to evoke EMG responses by optical simulation at cortical spots from ML 0.5 to 3.0 mm in Thy1-ChR2 mice. Repeated one-way ANOVA followed by Tukey’s test, *p < 0.05 and **p < 0.01; n= 4. (H) Thresholds of EMG responses by optical simulation in Thy1-ChR2 and Thy1-ChR2; Chx10-Cre mice + AAV8-Syn-DIO-hM4Di pre- and post-CNO injections. Paired t test (left bars, n = 16, 4 animals) and Wilcoxon matched-pairs signed-rank test (right bars, n = 25, 7 animals), **p < 0.01. See also Figure S5.

