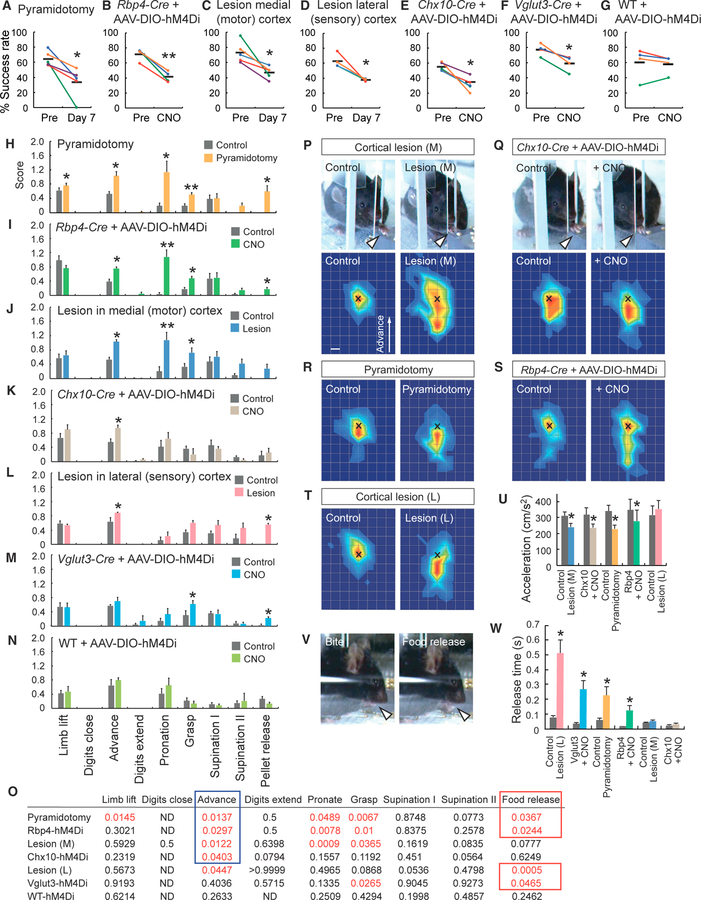
Figure 7. Variable Deficits in Skilled Motor Behaviors Induced by Silencing or Ablating Neurons within Motor and Sensory CS Circuits.
(A–G) Success rates of individual mice in a single-pellet reaching test. Pyramidotomy (A), Rbp4-Cre + AAV-DIO-hM4Di + CNO (B), lesions in the medial (motor) cortex (C), lesions in the lateral (sensory) cortex (D), Chx10-Cre + AAV-DIO-hM4Di + CNO (E), Vglut3-Cre + AAV-DIO-hM4Di + CNO (F), and wild-type (WT) + AAV-DIO-hM4Di + CNO (G) are shown. Colored circles and lines are success rates for individual mice pre- and post-manipulation (injury or CNO injection), with horizontal black bars showing group averages. Paired t test or Wilcoxon matched-pairs signed-rank test, *p < 0.05 and **p < 0.01; n = 4–5. (H–N) Motion component scores in the reaching test of mice with pyramidotomy (H), Rbp4-Cre + AAV-DIO-hM4Di + CNO) (I), lesions in the medial cortex (J), Chx10-Cre + AAV-DIO-hM4Di + CNO (K), lesions in the lateral cortex (L), Vglut3-Cre + AAV-DIO-hM4Di + CNO (M), and WT + AAV-DIO-hM4Di + CNO (N). Data are represented as mean ± SEM (n = 4–5). Paired t test or Wilcoxon matched-pairs signed-rank test, *p < 0.05 and **p < 0.01. (O) The p values for comparisons of each motion component between control and treated mice analyzed in (H)–(N), with motions showing differences (p < 0.05) represented in red. Common deficits were seen in the advancement (encircled in blue) and food release phases (encircled in red) by suppression of motor and sensory CST-related neurons, respectively. (P–T) Kinematic analyses of aberrant reaching in the advancement phase in mice with medial cortex lesions (P), silencing Chx10+ INs (Q), with pyramidotomies (R), silencing Rbp4+ layer V neurons (S), and with lateral cortex lesions (T). Note the short reaching distance in treated mice (arrowheads in P and Q). Bottom panels show heatmaps of the spatial probabilities of the far distal positions of the reaching paw relative to the pellet position (‘‘x’’). Top view: upward, the advanced direction of the forelimb. Mice with the medial cortex lesions (control, 78 reaches; injury, 121 reaches); Chx10-Cre + AAV-DIO-hM4Di (control, 84 reaches; post-CNO injection, 109 reaches); pyramidotomies (control, 88 reaches; injury, 118 reaches); Rbp4-Cre + AAV-DIO-hM4Di (control, 64 reaches; post-CNO, 110 reaches); lateral cortex lesions (control, 64 reaches; injury, 92 reaches). Scale bar, 2 mm. (U) Acceleration of paw movement (cm/s2) during the advancement step in groups with the medial cortex lesion (M), Chx10-Cre + AAV-DIO-hM4Di with/without CNO, and other groups. Data are represented as mean ± SEM (n = 4–5). Paired t test, *p < 0.05. (V) Images of food manipulation and release. A control mouse bites the pellet and quickly releases its grip on the pellet (arrowheads). (W) Releasing time of food in lateral cortex-lesioned mice (L), Vglut3-Cre + AAV-DIO-hM4Di with/without CNO, and other groups. Data are represented as mean ± SEM (n = 4–5). Paired t test, *p < 0.05. See also Figures S6 and S7.

