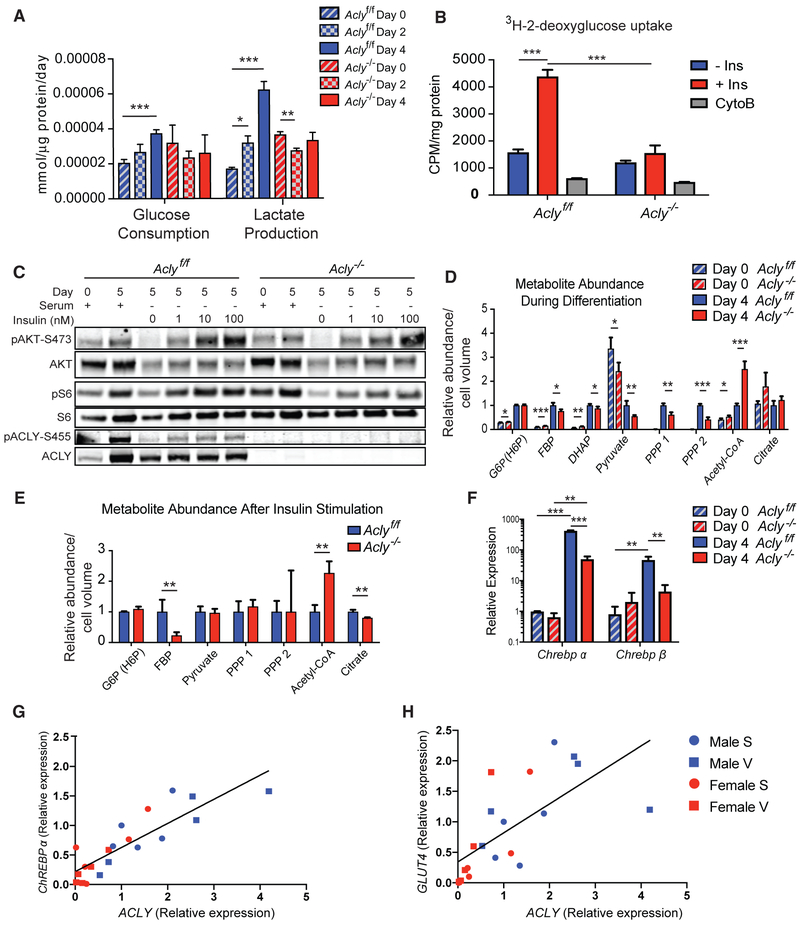
Figure 2. ChREBP Activation Is ACLY Dependent during Adipocyte Differentiation.
(A) Rates of glucose consumption and lactate production were analyzed using a YSI Bioanalyzer.
(B) Insulin-stimulated uptake of 3H-2-deoxyglucose; Ins, insulin; CytoB, cytochalasin B.
(C) Cells were differentiated, serum starved overnight, and treated with indicated doses of insulin for 10 min. Day indicates day after induction of differentiation. Insulin signaling was analyzed by western blot.
(D and E) Metabolite levels were quantified by LC-MS in day 0 preadipocytes and day 4 adipocytes under standard culture conditions (D) and in day 4 adipocytes after 15 min after insulin stimulation (E). The 3 PPP intermediates, ribulose-5-phosphate, xylulose-5-phosphate, and ribose-5-phosphate, share the same exact mass, which was quantified in 2 separate peaks designated as PPP1 and PPP2.
(F) qPCR analysis of Chrebpα and Chrebpβ expression.
(G and H) Correlation of relative mRNA expression of ACLY with ChREBPα (G) and GLUT4 (H) in human adipose tissue samples. S, subcutaneous; V, visceral depots. All bar graphs depict mean ± SEM of biological triplicates. Statistics by two-tailed t test, *p < 0.05; **p < 0.01; ***p < 0.001.

