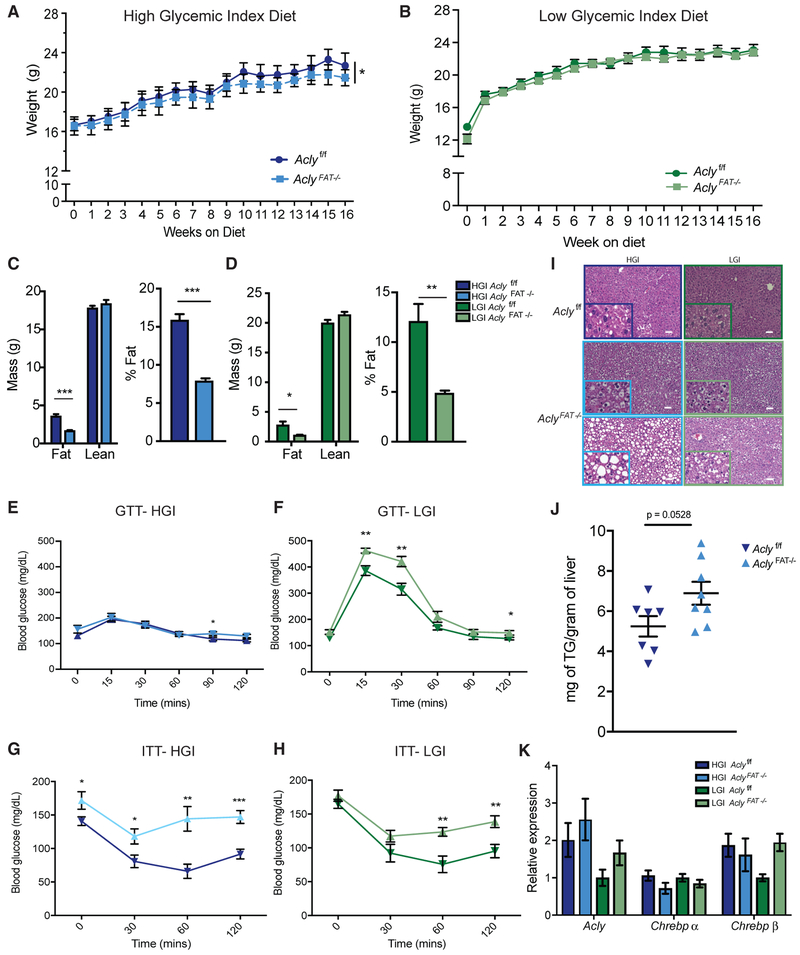
Figure 6. Female AclyFAT−/− Mice Are Insulin Resistant on Both LGI and HGI Diets but Accumulate More Hepatic Lipid when Consuming HGI Carbohydrates.
(A–K) Upon weaning, female Aclyf/f and AclyFAT−/− mice were fed matched high- or low-glycemic-index (HGI or LGI, respectively) diets for 16 weeks.
(A and B) Body weights on HGI (A) and LGI (B) diet, respectively, analyzed by two-way ANOVA.
(C and D) Body composition measure by MRI after 16 weeks on HGI (C) and LGI diets (D).
(E and F) GTT after 11 weeks on HGI (E) and LGI (F) diets.
(G and H) ITT after 14 weeks on HGI (G) and LGI (H) diets.
(I) Representative liver histology; scale bars represent 50 μm.
(J) Triglyceride levels in HGI-fed mice.
(K) qPCR gene expression analysis in liver.
For HGI diet, n = 8 female Aclyf/f, n = 8 female AclyFAT−/−. For LGI diet, n = 7 female Aclyf/f, n = 8 AclyFAT−/−. For all panels, error bars indicate mean ± SEM. Statistics by two-tailed t test unless ANOVA is indicated for panel. *p < 0.05; **p < 0.01; ***p < 0.001.

