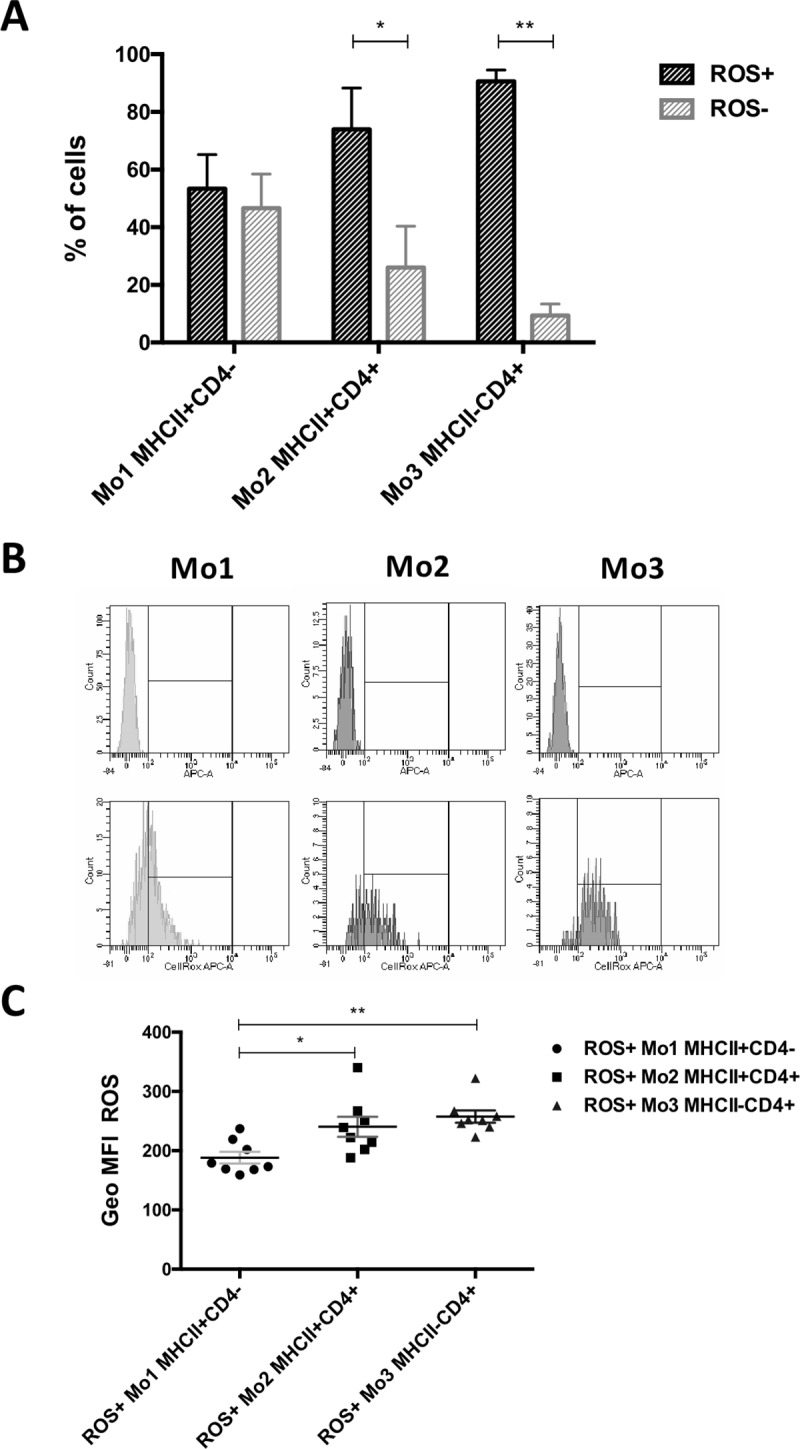
Fig 5. The basal production of reactive oxygen species by canine monocyte subsets.

(A) The percentages of non-activated cells producing reactive oxygen species (ROS+) and non-producing reactive oxygen species (ROS-) within each monocyte subset: Mo1 MHCII+CD4–, Mo2 MHCII+CD4+ and Mo3 MHCII–CD4+; (B) representative fluorescence histograms depicting cytometrical analysis of ROS production by the cells. (C) Geo MFI (geometric mean fluorescence intensity, given by flow cytometer) of ROS for positive cells (producing ROS in non-activated state) from each monocyte subset. Data are presented as mean ± SD (n = 8); the significance was determined by Wilcoxon test (A) and ANOVA Friedman with Dunn’s post hoc tests (C) (*p < 0.05; **p ≤ 0.01).
