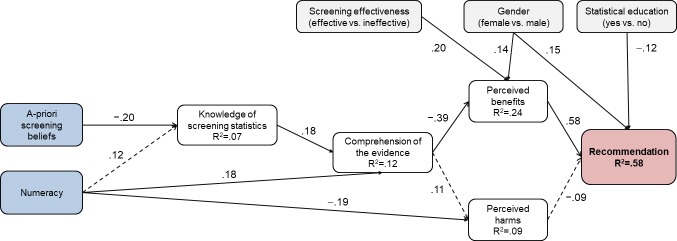
Fig 3. Path analysis results.
Displayed coefficients are standardized Betas. Continuous lines indicate significant paths (p < .05). Dashed lines indicate non-significant paths (p>.05) that were hypothesized to be significant. R2 = percentage of explained variance by all predictors. Blue indicates independent variables, white mediator variables, grey control variables, and red the outcome variable.

