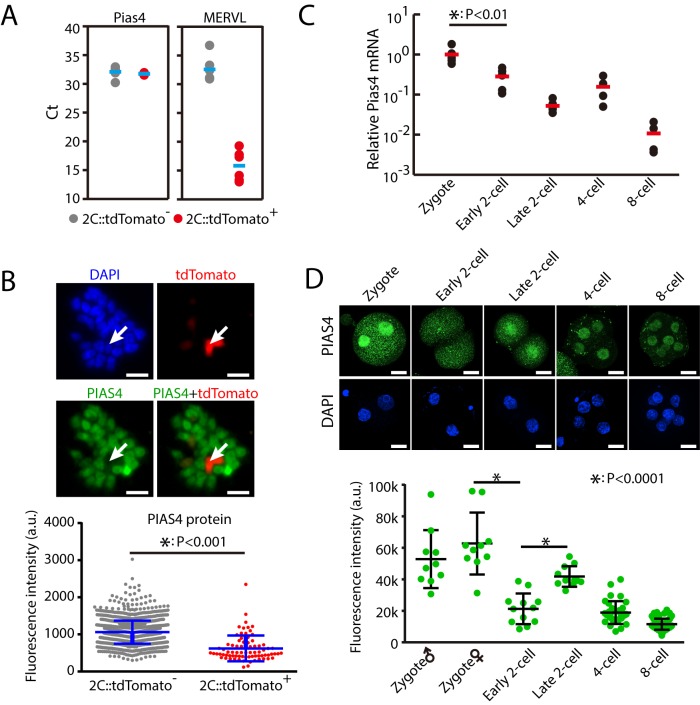
Fig 2. PIAS4 is down-regulated during ZGA and in 2C-like cells.
(A) Single-cell RT-qPCR of Pias4 in 2C::tdTomato-positive and negative cells. Shown are Ct values. Each dot represents one cell. n = 6. As expected, MERVL was significantly up-regulated in 2C::tdTomato-positive cells. (B) IF staining of PIAS4 protein in 2C::tdTomato-positive and negative ESCs. Shown are representative images (left) and quantification of fluorescence intensity with mean ± SD (right). Scale bars, 20 μm. n = 77 tdTomato-positive cells and 1,478 tdTomato-negative cells. Each dot represents one cell. The p-value was calculated by two-tailed Student's t test. (C) Single-embryo RT-qPCR of Pias4 from zygote to the 8-cell stage. Shown is the Pias4 level normalized to zygote stage. Each dot represents one embryo. n = 6 for zygote, early 2C stage, and late 2C stage, and n = 4 for 4-cell and 8-cell stages. The p-value was calculated by two-tailed Student's t test. (D) IF staining of PIAS4 in mouse embryo from zygote to 8-cell stage. Top, representative images. Scale bars, 20 μm. Bottom, fluorescence intensity in nucleus. Shown are mean ± SD. Six to 10 embryos were analyzed at each stage. Each dot represents one nucleus. The p-value was calculated by one-way ANOVA followed by two-tailed Dunnett's test. Source data for A-D can be found in the supplemental data file (S1 Data). 2C, 2-cell; a.u., arbitrary units; Ct, cycle threshold; ESC, embryonic stem cell; IF, immunofluorescence; MERVL, murine endogenous retrovirus-L; Pias4, protein inhibitor of activated STAT 4; RT-qPCR, quantitative reverse transcription PCR; tdTomato, tandem dimeric Tomato; ZGA, zygotic genome activation.

