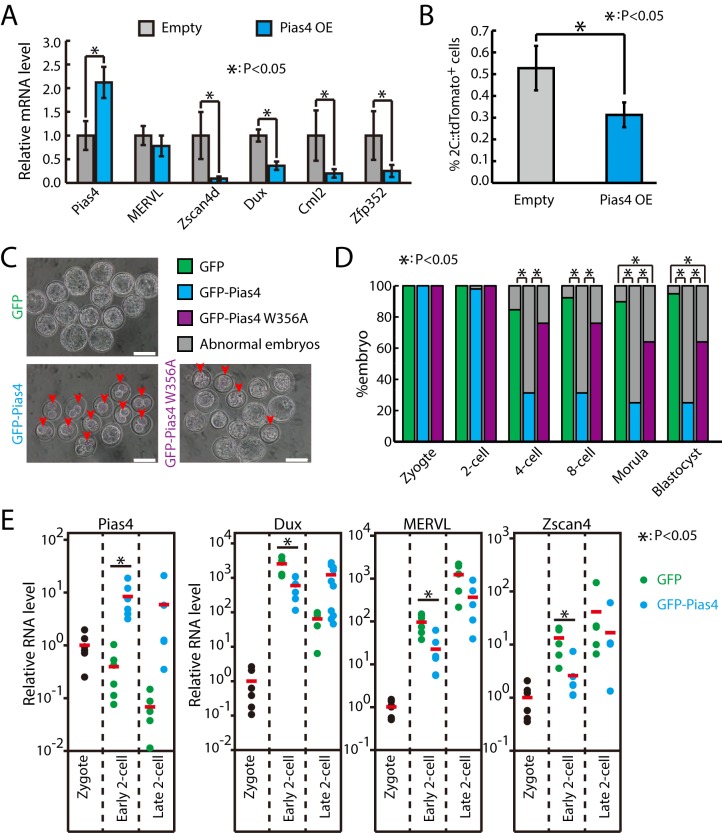
Fig 3. Pias4 OE inhibits zygotic transcriptional program and impairs early embryo development.
(A) RT-qPCR of Dux and other 2 cell–specific genes in control and Pias4-overexpressing ESCs. The β-actin gene was used as a control. For each gene, data were normalized to the mRNA level of control OE ESCs. Shown are mean ± SD, n = 3. The p-value was calculated by two-tailed Student’s t test. (B) Fraction of 2C::tdTomato-positive cells in control and Pias4-overexpressing ESCs. Data are presented as mean ± SD, n = 3. The p-value was calculated by two-tailed Student’s t test. (C) Development of zygotes that were injected with in vitro transcribed GFP, GFP–Pias4, and GFP–Pias4 W356A mRNAs. Shown are representative images at development time equivalent to blastocyst stage. Arrows point to abnormal embryos. Scale bars, 100 μm. (D) Development of zygote injected with GFP, GFP–Pias4, and GFP–Pias4 W356A mRNAs. Shown is the percentage of normally developed embryos. n = 39, 48, and 25 for GFP, GFP–Pias4, and GFP–Pias4 W356A mRNA–transfected embryos from three independent experiments, respectively. The p-value was calculated by Pearson's chi-squared test. (E) Single-embryo RT-qPCR of embryos injected with GFP or GFP–Pias4 mRNA in early and late 2-cell stages. Data were normalized to zygote stage. Each dot represents one embryo. Red bars indicate mean value. n = 6 for zygote, early 2-cell and n = 5 for late 2-cell. The p-value was calculated by two-tailed Student’s t test. Source data for A, B, D, and E can be found in the supplemental data file (S1 Data). Dux, double homeobox; ESC, embryonic stem cell; GFP, green fluorescent protein; MERVL, murine endogenous retrovirus-L; OE, overexpression; Pias4, protein inhibitor of activated STAT 4; RT-qPCR, quantitative reverse transcription PCR; tdTomato, tandem dimeric Tomato; Zfp352, zinc finger protein 352; Zscan4d, zinc finger and SCAN domain containing 4D.

