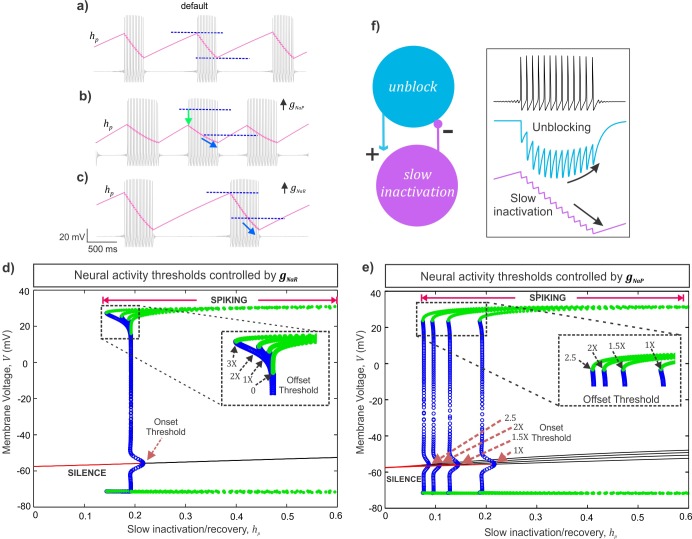
Fig 6. Analysis of a mechanism of action of INaR and INaP.
a-c) The slow INaP inactivation/recovery variable, hP is overlaid (magenta) on membrane voltage traces (grey) under default (a), 1.5x gNaP (b), and 2x gNaR (c) conditions; the dark blue dashed lines in (a-c) indicate the maximum and minimum values of the persistent inactivation variable under default condition; the light green arrow in (b), highlights a reduced peak recovery required for burst onset; the light blue curvy arrows in (b, c) indicate further accumulation of slow inactivation before burst termination. d, e) Bifurcation diagrams showing the steady states and spiking regimes of the membrane voltage (V) and slow INaP inactivation/recovery (hp). The red solid lines represent resting/quiescence states consistent with low values of hp. The meeting points of stable equilibria (red) and unstable equilibria (black solid lines) represents the theoretical threshold for burst onset, the Hopf bifurcation point (see S1 Text). The blue open circles are the unstable periodics that form region of attraction on either side of the stable equilibria for sub-threshold membrane voltage oscillations; the meeting point of the curve of unstable periodics with the stable periodics (green filled circles) represents the theoretical threshold for burst offset/termination, saddle node of periodics (see S1 Text). The dashed boxes in (d) and (e) magnify the burst offset thresholds due to increases in gNaR (d) and gNaP (e); brown dashed arrows in (e) highlight shifts in burst onset thresholds due to gNaP increases; 1X gNaR = 3.3 nS/pF and 1X gNaP = 0.5 nS/pF. f) Schematic showing a negative feedback loop between the unblocking process and the slow inactivation of the Na+ currents. Inset shows membrane potential (top), blocking variable, br (middle) and slow inactivation, hr (bottom), illustrating the negative feedback mechanism.

