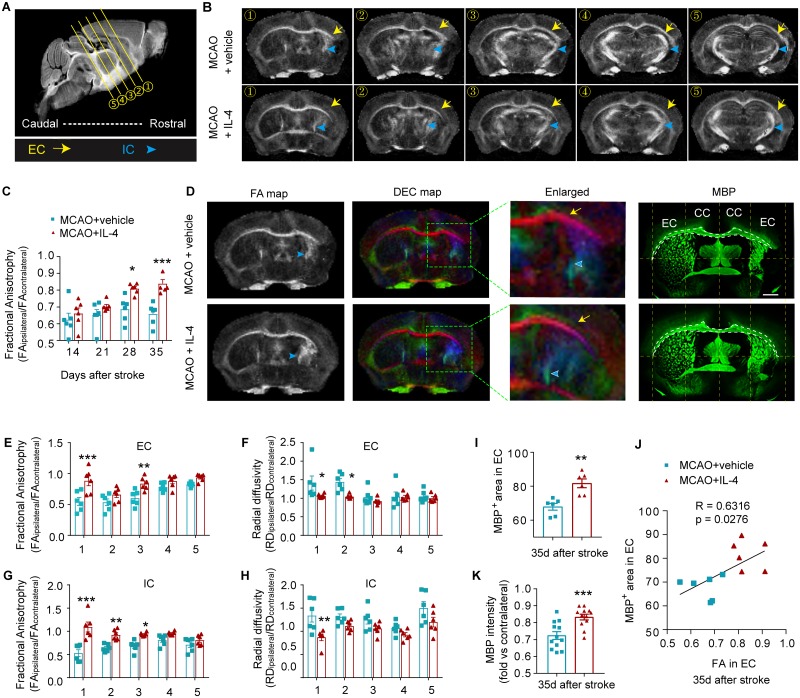
Fig 4. IL-4 treatment after stroke enhances white matter integrity.
(A) A sagittal section showing the locations of 5 representative scanning planes from rostral to caudal. (B) Representative axial views (5 sections from rostral to caudal) of FA map 35 d after stroke. Yellow arrows indicate the EC. Blue arrow heads indicate the IC. (C) Quantification of FA values in the EC at different days after MCAO. Data are expressed as the ratio of FA values in the ipsilateral (lesioned) side to the FA values in the nonlesioned contralateral hemispheres. n = 6/group. *p < 0.05, ***p < 0.001 versus vehicle at indicated time points. Two-way repeated-measures ANOVA and Bonferroni post hoc. (D) Representative FA map and DEC map of the same ex vivo brains 35 d after stroke. MBP (green) immunostaining was performed on the same brains. Scale bar: 1 mm. (E-H) Quantification of FA and RD in the EC (E and F) and IC (G and H) at five axial levels from rostral to caudal. n = 6/group. *p < 0.05, **p < 0.01, ***p < 0.001 versus MCAO + vehicle at the same plane of section. Two-way ANOVA and Bonferroni post hoc. (I) The areas of the EC were assessed on MBP-stained brain sections. n = 6/group. (J) The Pearson correlation between the FA value and histological analysis of myelin in the EC. n = 6/group. (K) Quantification of MBP intensity in peri-infarct areas. Data are calculated as fold change compared to corresponding contralateral areas. n = 12/group. **p < 0.01, ***p < 0.001 versus MCAO + vehicle, Student’s t test. Data associated with this figure can be found in the supplemental data file (S1 Data). CC, corpus callosum; DEC, directionally encoded color; EC, external capsule; FA, fractional anisotropy; IC, internal capsule; IL-4, interleukin-4; MBP, myelin basic protein; MCAO, middle cerebral artery occlusion; RD, radial diffusivity.

