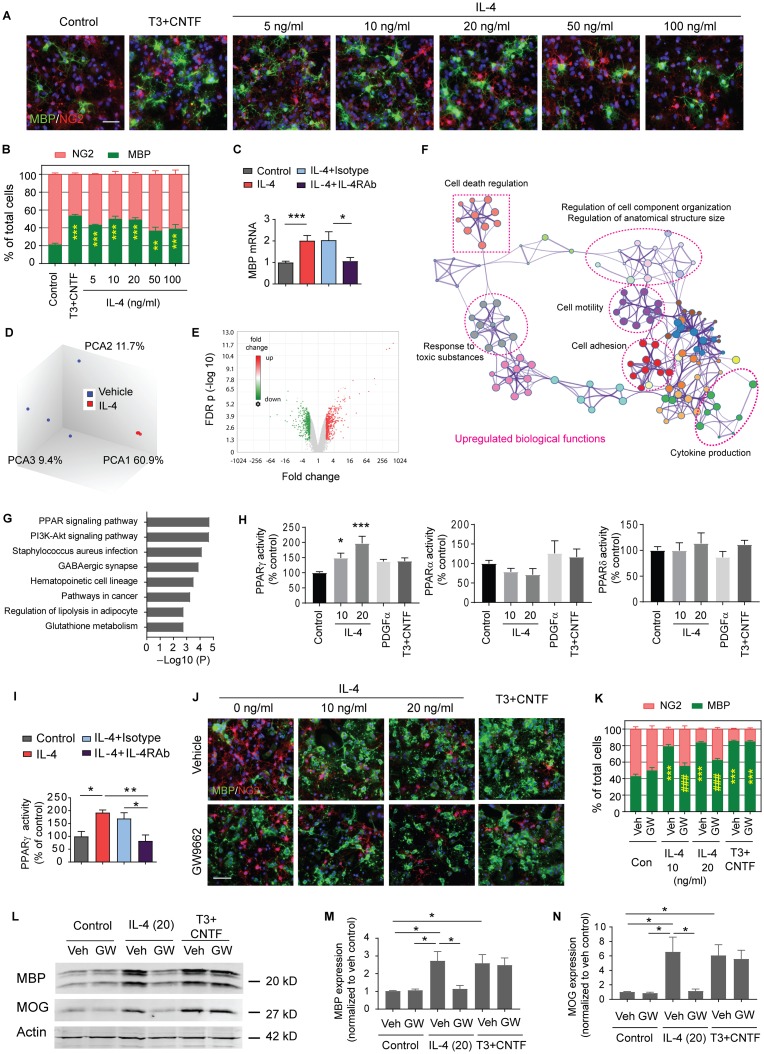
Fig 8. PPARγ is essential for IL-4-induced OPC differentiation in vitro.
(A-C) OPCs were treated with vehicle (PBS), various concentrations of IL-4, or T3 (50 ng/mL)+CNTF (10 ng/mL) for 3 d. (A) Double staining of MBP (green) and NG2 (red). Nuclear staining with DAPI is shown in blue. Scale bar: 50 μm. (B) Quantification of MBP+ cells and NG2+ cells as percentages of total cells. Three independent experiments in duplicate. **p < 0.01, ***p < 0.001 versus control. Two-way ANOVA and Bonferroni post hoc. (C) Expression of mbp was assessed by qRT-PCR 3 d after vehicle or IL-4 (20 ng/mL) treatment. Pretreatment with IL-4RAbs (20 ng/mL) for 30 min blocked the IL-4-enhanced expression of mbp compared to isotype control antibodies (20 ng/mL). Data are fold change relative to control. n = 5–9/group. *p < 0.05, ***p < 0.001. Student’s t test. (D-G) Microarray analyses on OPCs treated with PBS or IL-4 (20 ng/mL) for 3 d. n = 4/group. (D) PCA of microarray expression profiles. (E) Volcano plot. (F) Network plot showing enriched GO biological processes that were up-regulated by IL-4 treatment. (G) KEGG pathways that were significantly up-regulated in IL-4-treated OPCs. (H) Quantification of PPAR DNA binding activity. n = 4/group. *p < 0.05, ***p < 0.001 versus control. One-way ANOVA and Bonferroni post hoc. (I) Quantification of PPARγ DNA binding activity in vehicle or IL-4 (20 ng/mL)–treated OPCs, with or without IL-4Rα neutralizing Ab or isotype IgG (20 ng/mL). n = 4–6/group. *p < 0.05, **p < 0.01. One-way ANOVA and Bonferroni post hoc. (J-N) OPCs were treated with the PPARγ inhibitor GW9662 (0.5 μM) or DMSO (“Veh”) for 30 min, followed by IL-4, vehicle control (PBS), or T3+CNTF for 5 d. (J) Immunostaining of MBP (green) and NG2 (red). Scale bar: 50 μm. (K) Quantification of MBP+ cells and NG2+ cells as percentages of total cells. Three independent experiments in duplicate. ***p < 0.001 versus control. ###p < 0.001 versus IL-4+veh. Two-way ANOVA and Bonferroni post hoc. (L) Representative western blots of MBP and MOG. (M-N) Quantification of MBP (M) and MOG (N) expression in western blots. n = 3/group. *p < 0.05. One-way ANOVA and Bonferroni post hoc. Data associated with this figure can be found in the supplemental data file (S1 Data). CNTF, ciliary neurotrophic factor; FDR, false discovery rate; GO, gene ontology; IgG, immunoglobulin G; IL-4, interleukin-4; IL-4RAb, IL-4 receptor α neutralizing antibody; KEGG, Kyoto Encyclopedia of Genes and Genomes; MBP, myelin basic protein; MOG, myelin oligodendrocyte glycoprotein; NG2, neuron-glia antigen 2; OPC, oligodendrocyte progenitor cell; PCA, principal component analysis; PDGFα, platelet-derived growth factor alpha; PI3K, phosphoinositide 3-kinase; PPAR, peroxisome proliferator-activated receptor; qRT-PCR, quantitative reverse transcription PCR.

