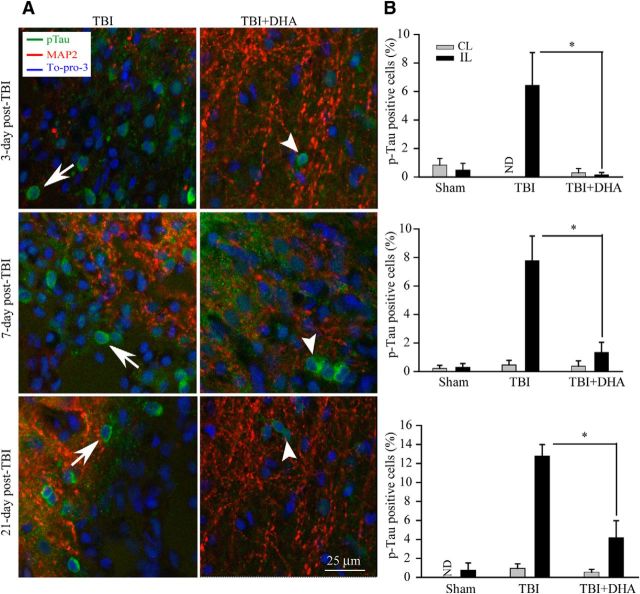
Figure 7.
Effect of DHA on the expression of p-Tau in the IL cortex after TBI. A, Confocal images showing expression of p-Tau in the perilesion frontal cortex tissues at 3, 7, and 21 d post-TBI. A, Arrow, Increased expression of p-Tau (green) in cell bodies. A, Arrowhead, Reduced expression of p-Tau in DHA treated brains. B, Summary data of p-Tau-immunopositive cells. Values are mean ± SE (n = 3) and expressed as percentage of p-Tau positive cells. *p < 0.05 versus TBI vehicle control.

