Figure 2.

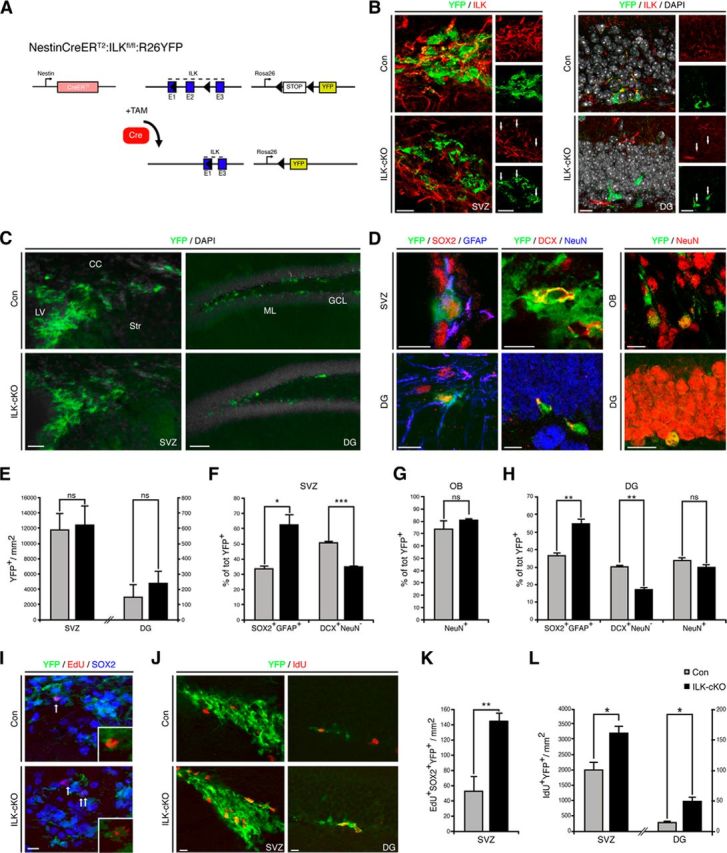
Deletion of ILK enhances NSPC proliferation in the SVZ and DG. A, Schematic illustration of the genetic deletion of ILK using Nestin-CreERT2 mice combined with ROSA-YFP reporter mice. B, Selective ILK ablation on recombined YFP-expressing NSPCs in SVZ (left panels) and DG (right panels). C, Conditional deletion of ILK does not alter the number of YFP-labeled, recombined cells (green) in the SVZ or DG. Shown are representative images of YFP-labeled cells in the SVZ (left panels) and the DG (right panels) 43 d after last TAM injection. D, Representative images of recombined cells expressing YFP (green), SOX2 (red), and GFAP (blue) in SVZ (left, top) and DG (left, bottom). Representative pictures of recombined cells expressing YFP (green) and DCX (red) but not NeuN (blue) markers in SVZ (middle, top) and DG (middle, bottom). Representative pictures of YFP-positive (green) recombined cells expressing the neuronal marker NeuN (red) in the OB (right, top) and DG (right, bottom). E, Quantification of YFP-positive cells per area in the SVZ and DG. F, H, Genetic deletion of ILK increases the fraction of YFP-labeled cells expressing SOX2 and GFAP but decreases the number of DCX-positive neuroblasts in the adult SVZ (F) and adult DG (H). G, H, The number of YFP-expressing NeuN+ neurons is unchanged in both OB (G) and DG (H). I, Representative pictures of recombined (green) EdU-long retaining cells (red) coexpressing SOX2 (blue) in the SVZ of control and ILK-mutants. J, Representative pictures of recombined (green) IdU fast-cycling cells (red) in the SVZ (left panels) and DG (right panels) of control and ILK mutants. K, Quantification of long retaining EdU/SOX2/YFP-positive cells per area, indicating enhanced proliferation of SOX2-expressing cells in the SVZ. L, Quantification of IdU+YFP+ cells in the two neurogenic regions of the adult brain. The number of fast-cycling IdU+ cells is increased upon ILK ablation. LV, Lateral ventricle; CC, corpus callosum; Str, striatum; GCL, granule cell layer; ML, molecular layer. Data are presented as the mean ± SEM. Scale bars: C, left panels, 25 μm; C, right panels, 80 μm; B, D, I, J, 10 μm. *p < 0.05,**p < 0.01, ***p < 0.001.
