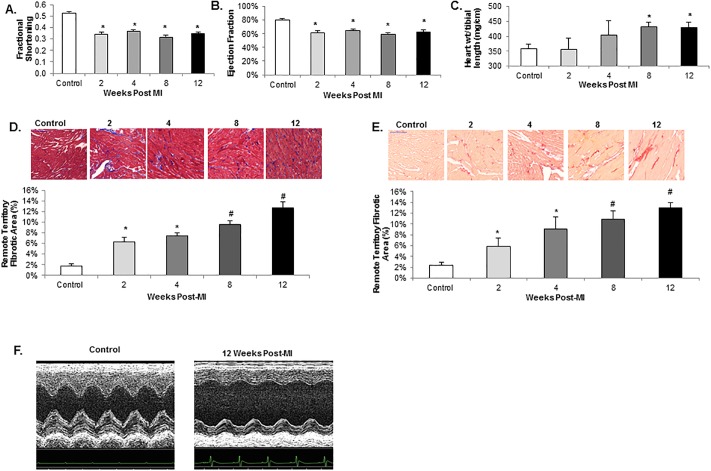
Fig 1. Development of post-infarction ventricular dysfunction and myocardial fibrosis.
A. Fractional shortening 2–12 weeks post-myocardial infarction (MI) vs. control showing early development of cardiac dysfunction that is sustained through 12 weeks. *p<0.0001 vs. control; n = 4–6 in each group. B. Ejection Fraction 2–12 weeks post-MI vs. control. *p<0.001 vs. control; n = 4–6 in each group. C. Heart weight to tibial length ratio post-MI vs. control showing development of significant cardiac hypertrophy by 8 weeks. *p<0.025 vs. control; n = 3–6 in each group. D. Representative photomicrographs of Masson trichrome stained remote (non-infarct) territories of left ventricles (20x) (above) 2–12 weeks post-MI vs. control. Quantitation of percent fibrotic area (purple/blue staining area) in remote territories of left ventricle shown below. *p<0.03 vs. control, #p<0.02 vs. control and vs. 2 and 4 weeks post-MI; n = 3–8 in each group. E. Representative photomicrographs of picrosirius red stained remote (non-infarct) territories of left ventricles (20x) (above) 2–12 weeks post-MI vs. control. Quantitation of percent fibrotic area (red staining area) in remote territories of left ventricle shown below. *p<0.04 vs. control, #p<0.01 vs. control and vs. 2 weeks post-MI; n = 3–8 in each group. F. M-mode echocardiography of control and 12 weeks post-MI rats.

