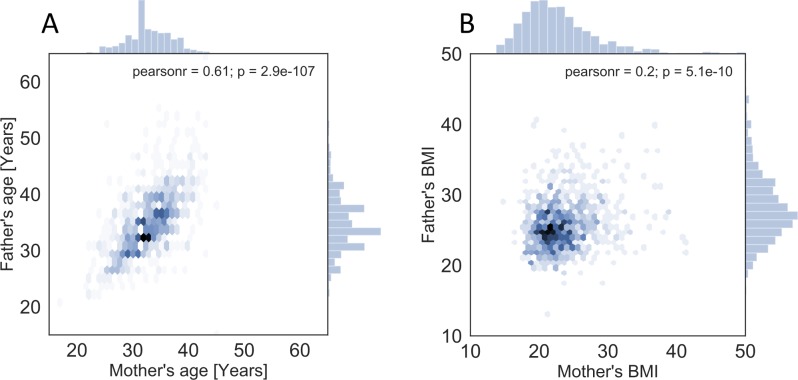
Figure 3.
Parent’s age (A) and BMI (B) distribution and their correlation between the parents within a family. Data are plotted on hexagonal bins, which are shaded according to the count of the data points in the aggregate. In addition, histograms of the maternal and paternal values are plotted on the top and right, respectively. BMI, body mass index.

