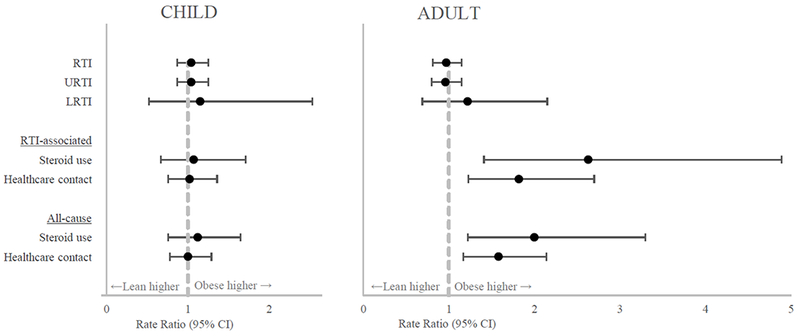
Figure 1: The risk of Respiratory Tract Infection (RTI) and RTI-associated asthma morbidity in obese vs lean participants.

RTI – respiratory tract infection; URTI – upper respiratory tract infection; LRTI – lower respiratory tract infection. Bold indicates statistical significance (p<0.05). Points are rate ratios comparing obese and lean participants with bars indicating the 95% confidence interval. Dashed gray line is the reference rate ratio of 1.0. P-values determined by negative binomial regression.
