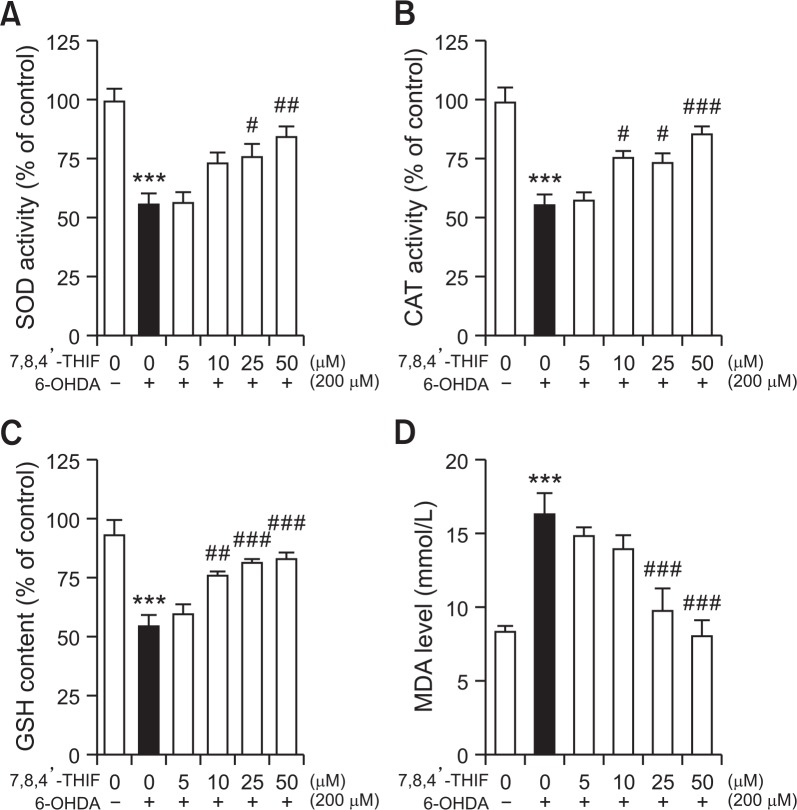
Fig. 3.
Effects of 7,8,4′-THIF on 6-OHDA-induced SOD (A) and CAT (B) activities, GSH content (C), and MDA level (D) in SH-SY5Y cells. The cells were pretreated with 7,8,4′-THIF (5, 10, 25, or 50 μM) for 30 min followed by exposure to 200 μM 6-OHDA for 6 or 24 h. SOD and CAT activities, GSH content, and MDA level were assessed using commercial assay kits and are expressed as a percentage of the corresponding values for the control group. The data are presented as mean ± SEM (n=6). ***p<0.001 compared with the control group. #p<0.05, ##p<0.01, and ###p<0.001 compared with the 6-OHDA-treated group.

