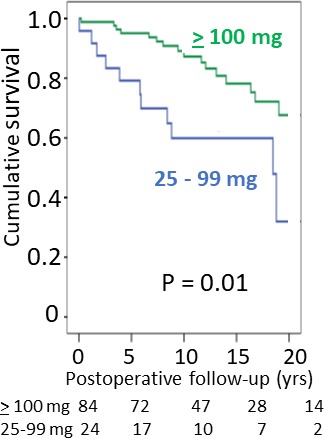
Figure 3.

Kaplan-Meier survival curves illustrating postintervention freedom from disease-related death in patients who have received interventional treatment with either short atrioventricular (AV) delay pacing or myectomy related to postintervention dose of beta-blocker therapy. The green curve illustrates survival with postintervention dose of ≥100 mg/day of metoprolol equivalents, and the blue curve the inferior survival with metoprolol-equivalent doses of 25–99 mg/day (p=0.010).
