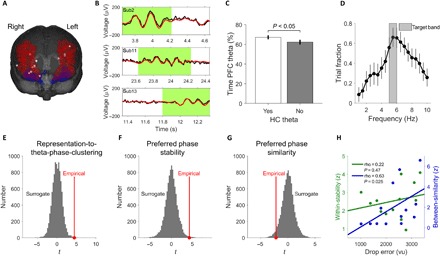
Fig. 6. Dynamic reactivation of cue representations at distinct prefrontal theta phases during goal-directed navigation.

(A) Prefrontal electrode channels. Each white dot, one channel from a separate patient (n = 13). Blue, lateral orbitofrontal cortex; red, rostral middle frontal gyrus. (B) Exemplary time periods with theta oscillations during goal-directed navigation from different patients. Black, raw signal; red, low-frequency component of the raw signal (passband, 1 to 10 Hz); green shading, time periods with theta oscillations as detected by MODAL. (C) Prefrontal (“PFC”) theta oscillations occurred in temporal proximity to hippocampal theta oscillations as shown by an increased percentage of time with prefrontal theta oscillations when hippocampal theta oscillations were present as compared to when they were not present. (D) Prefrontal theta oscillations preferentially occurred at a frequency of 5 to 6 Hz. Dots represent mean, and vertical lines represent SEM. (E) We assessed the significance of representation-to-theta-phase-clustering by comparing against a surrogate distribution that was obtained by circularly shifting the sliding RSA values against the concurrent prefrontal theta phases. Red dot and red line, empirical t statistic. (F) Stability of preferred theta phases across trials (within-stability). (G) Distinctiveness of preferred theta phases (between-similarity). (H) Lower between-similarity values are associated with better spatial memory performance.
