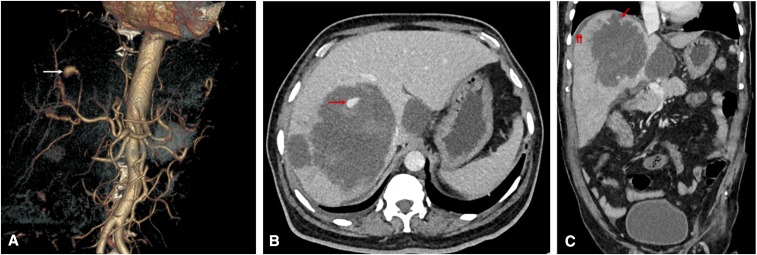
Figure 2.
(A) CT angiogram obtained on admission. The volume-rendered image shows an aneurysm of 10-mm size with its feeding artery arising from a branch of the right hepatic artery (arrow). (B) The axial CT image in the venous phase shows multiple hepatic abscesses, including the largest abscess in the right lobe showing a pseudoaneurysm peripherally within the cavity (arrow). The hyperdense areas surrounding the aneurysm represent fresh blood clots. (C) The coronal CT image shows an ill-defined breach in the abscess cavity superiorly (arrow), with small subphrenic fluid collection (double arrow) suggesting a contained rupture. This figure appears in color at www.ajtmh.org.

