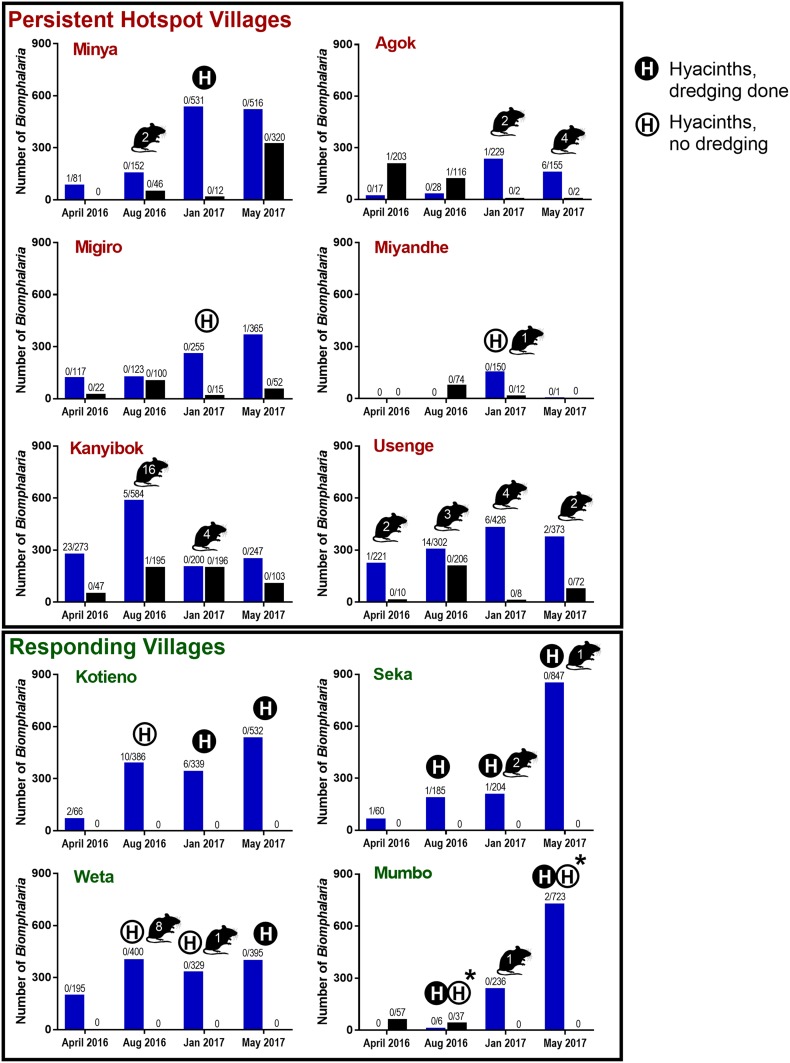
Figure 2.
Number of Biomphalaria sudanica (blue bars) and Biomphalaria choanomphala (black bars) collected at each of the four sampling times (April and August 2016, January and May 2017) from the six persistent hotspot villages on the top vs. the four responding villages on the bottom. Snail numbers are summed between collection sites at a village. Numbers over bars indicate number of snails infected with Schistosoma mansoni shedders/total number of snails found. Numbers shown within mouse figures represent the number of worms recovered from sentinel mice at that time point (summed across mice and collection sites at that village). An H in a closed circle indicates hyacinths were present and dredging was carried out. An H in an open circle indicates hyacinths were present, but dredging could not be carried out. An asterisk (*) indicates Kabuong Beach was dredged but not Mumbo Beach. This figure appears in color at www.ajtmh.org.

