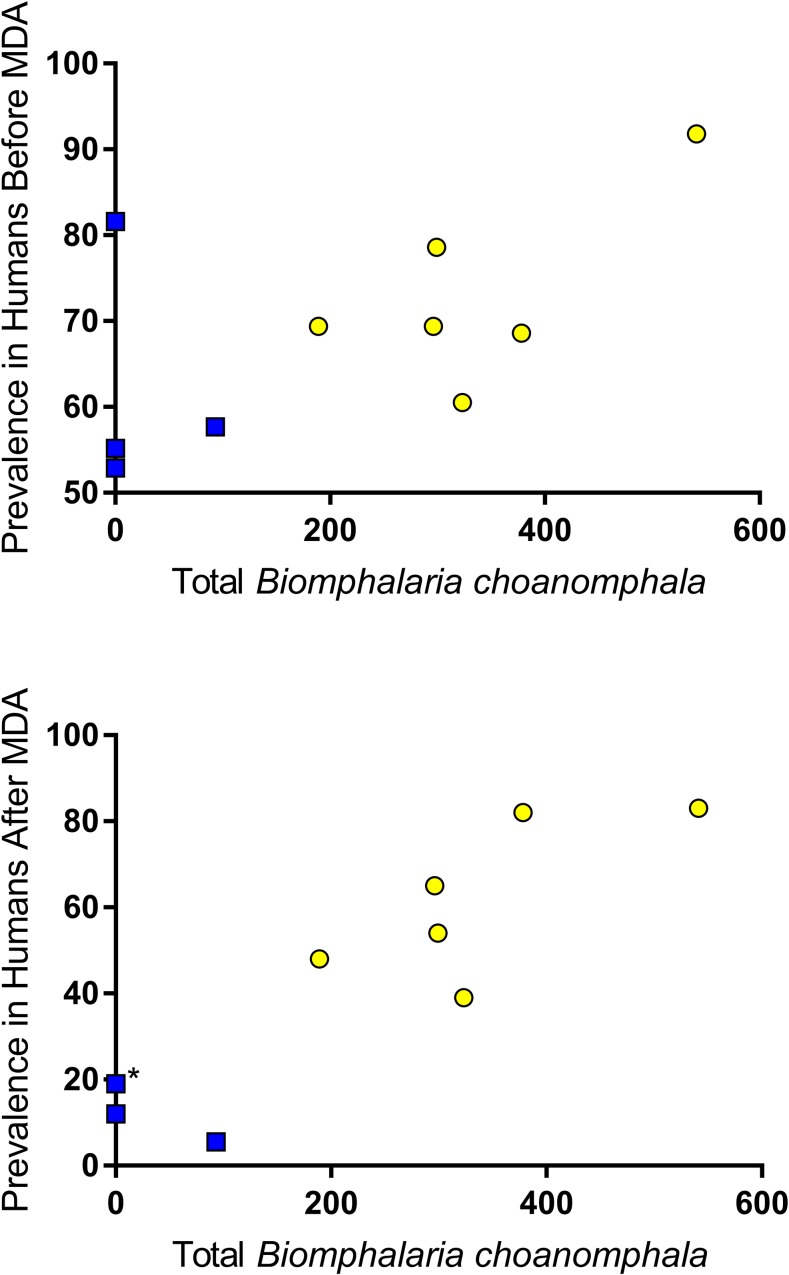
Figure 7.
Total number of Biomphalaria choanomphala collected at a village was significantly correlated with the prevalence of Schistosoma mansoni in humans both before and after mass drug administration (before: Pearson r = 0.587, r2 = 0.345, P = 0.037; after: Pearson r = 0.9034, r2 = 0.816, P = 0.0002). Yellow = persistent hotspot villages; blue = responding villages (*two villages with same prevalence). This figure appears in color at www.ajtmh.org.

