
Fig. 1. JAZF1 and CATACOMB are a NuA4 and a PRC2 subunit, respectively.
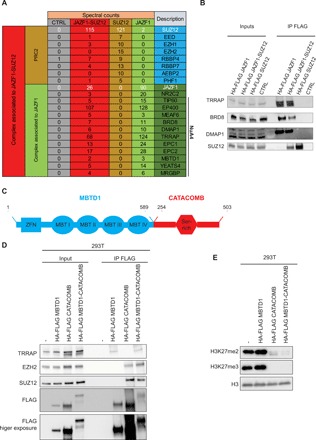
(A) Schematic representation of mass spectrometry data obtained from FLAG IPs from hEnSC wild type (WT) (CTRL), expressing the HA-FLAG versions of the JAZF1-SUZ12 fusion protein, SUZ12, or JAZF1. Numbers represent spectral counts. The far-right columns list the protein identification symbols. JAZF1 and SUZ12 (or JAZF1-SUZ12 in the fusion-expressing cells) are shown in white type face, as are the numbers for their spectral counts obtained in each experiment. The previously identified subunits for NuA4 are indicated. (B) FLAG-IP in HCT-116 cells that are either WT or express HA-FLAG versions of the JAZF1-SUZ12 fusion protein, full-length SUZ12, or full-length JAZF1. Ten percent of the input and 50% of the IP material were loaded for Western blot analysis. Antibodies used for Western blotting are indicated in the panel. (C) Schematic representation of the MBTD1-CATACOMB putative fusion protein including the domain previously reported. Numbers in black represent the amino acid residues. The MBTD1 portion is in blue, and the CATACOMB portion is in red. (D) FLAG-IP in 293T cells WT (−), expressing HA-FLAG versions of the MBTD1-CATACOMB putative fusion protein, full-length MBTD1, or full-length CATACOMB. Ten percent of the input and 50% of the IP material were loaded for Western blot analysis. Antibodies used for Western blotting are indicated in the panel. (E) Western blotting of chromatin extracts from cells described in (D). Antibodies used for Western blotting are indicated in the panel. Histone H3 (H3) served as a loading control.