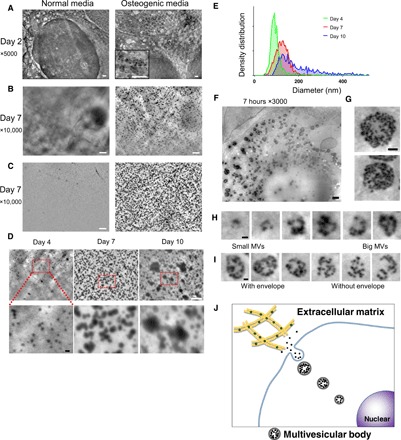
Fig. 1. Nanoscale observation of live osteoblasts in culture media, using the SE-ADM system.

(A) Representative high-resolution SE-ADM images of osteoblasts cultured with or without osteogenic media for 2 days. Black particles were evident only when cultured in osteogenic media (right, square in the bottom). (B) Representative high-resolution SE-ADM images of osteoblasts cultured with or without osteogenic media for 7 days. There are many black particles when cultured in osteogenic media (right). (C) Representative high-resolution SE-ADM images of the SiN film after cell removal. In normal media, no particles are observed (left). The image of the film after removal of cells cultured in osteogenic media shows many clear black particles dispersed in the whole area (right). (D) Comparison of particle images during 4 to 10 days of culture in osteogenic media. The particle sizes gradually increased. (E) Distribution of particle size measured during 4 to 10 days of culture in osteogenic media. Approximately 900 to 1100 particles per time point were measured and plotted as a histogram. (F) Representative high-resolution SE-ADM images of osteoblasts cultured with osteogenic media for 7 hours. (G) MVBs have clear gray envelopes. (H) Cut images of various MVB sizes, including particles. (I) Comparison of MVBs with or without a gray envelope. (J) Schematic view of intracellular formation and transport of MVB in mineralizing osteoblasts. Scale bars, 1 μm in (A) to (C) and (F); 500 nm in (G); 200 nm in (D, bottom), (H), and (I).
