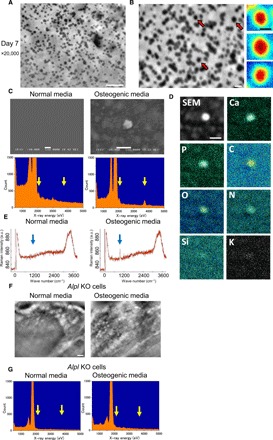
Fig. 2. Characterization of mineral containing vesicles.

(A and B) High-resolution particle images before (A) and after (B) removal of cells cultured in osteogenic media for 7 days. Pseudocolor maps of enlarged particle images indicated by red arrows are shown on the right side of (B). Particles show very smooth structures without crystals. (C) Scanning electron microscopy (SEM) images and EDX spectrometric analysis of particles on a SiN film. SEM image on the left side exhibits the SiN film after removal of cells cultured in normal media, which shows no particles, and EDX spectrometric data show no peaks of phosphorus and calcium. In contrast, the SEM image and EDX spectrometric data on the right side show particles and sharp peaks of phosphorus and calcium after culture in osteogenic media. (D) Analysis of particle elements using EDX spectrometric maps. Particles contained phosphorus, calcium, carbon, and nitrogen. (E) Raman spectra obtained from osteoblasts cultured with or without osteogenic media for 23 days. Sharp peak of 960 cm−1 was evident only in osteogenic media (right side). a.u., arbitrary units. (F) Comparison of SE-ADM images of Alpl knockout (KO) osteoblasts in normal and osteogenic media. Particles completely disappeared in osteogenic media. (G) EDX spectrum of particles from Alpl KO osteoblasts on a SiN film. Left-side EDX spectrometric data exhibit the SiN film after removal of cells cultured in normal media, which show no peaks of phosphorus and calcium. Moreover, particles in osteogenic media of right-side data show no peaks in phosphorus and calcium. Scale bars, 1 μm in (A), (C, top), (D), and (F); 200 nm in (B); 100 nm in (B, right).
